Page MenuHomeVyOS Platform

Improve VYOS_DEBUG profiling support
Open, HighPublicBUG

Assigned To
Authored By
v.huti
Apr 25 2022, 6:35 AM
Referenced Files
F2788621: perf.gif
Jun 21 2022, 10:48 PM
F2665434: artifacts.tar.gz
May 2 2022, 9:11 PM
F2665382: exec_cfg_node_.png
May 2 2022, 9:03 AM
F2665376: vy_output_internal.png
May 2 2022, 8:55 AM
F2665366: prio_subtree.png
May 2 2022, 8:55 AM
F2665368: check_cfg_node.png
May 2 2022, 8:55 AM
F2665370: exec_cfg_node.png
May 2 2022, 8:55 AM
F2665374: system_out.png
May 2 2022, 8:55 AM

Description

The kernel vyos-debug flag enables profiling for config loader

`vyos-1x/src/helpers/vyos-boot-config-loader.py` within
`/usr/libexec/vyos/init/vyos-router`

The issue is that measured time is rounded to decimal, making it useless in practical profiling.
Trivial commands like set integer can take as low as 0.01 seconds.
This change increases accuracy to milliseconds: https://github.com/vyos/vyatta-cfg/pull/47


The flag is exported only for boot as follows export VYOS_DEBUG=yes
Once you enter the config mode, it is missing in your environment, meaning profiling data is not saved.
You can export the flag manually and find the data after performing the commit or other action.

export VYOS_DEBUG=yes
mkdir /opt/vyatta/share/vyatta-cfg/templates/test
vyos@vyos# cat node.def 
---------------------------------------------------------------------------------------------------------
type: u32
help: test help
val_help: u32; test u32
syntax:expression: exec "
        set -x
        sleep 1
        ${vyos_libexec_dir}/validate-value  --exec \"${vyos_validators_dir}/numeric --range 1-200\" --value \'$VAR(@)\'"; "invalid value"
---------------------------------------------------------------------------------------------------------
[edit]
vyos@vyos# set test 123

  + sleep 1
  + /usr/libexec/vyos/validate-value --exec '/usr/libexec/vyos/validators/numeric --range 1-200' --value 123

[edit]
vyos@vyos# commit
[ test 123 ]
+ sleep 1
+ /usr/libexec/vyos/validate-value --exec '/usr/libexec/vyos/validators/numeric --range 1-200' --value 123
---------------------------------------------------------------------------------------------------------

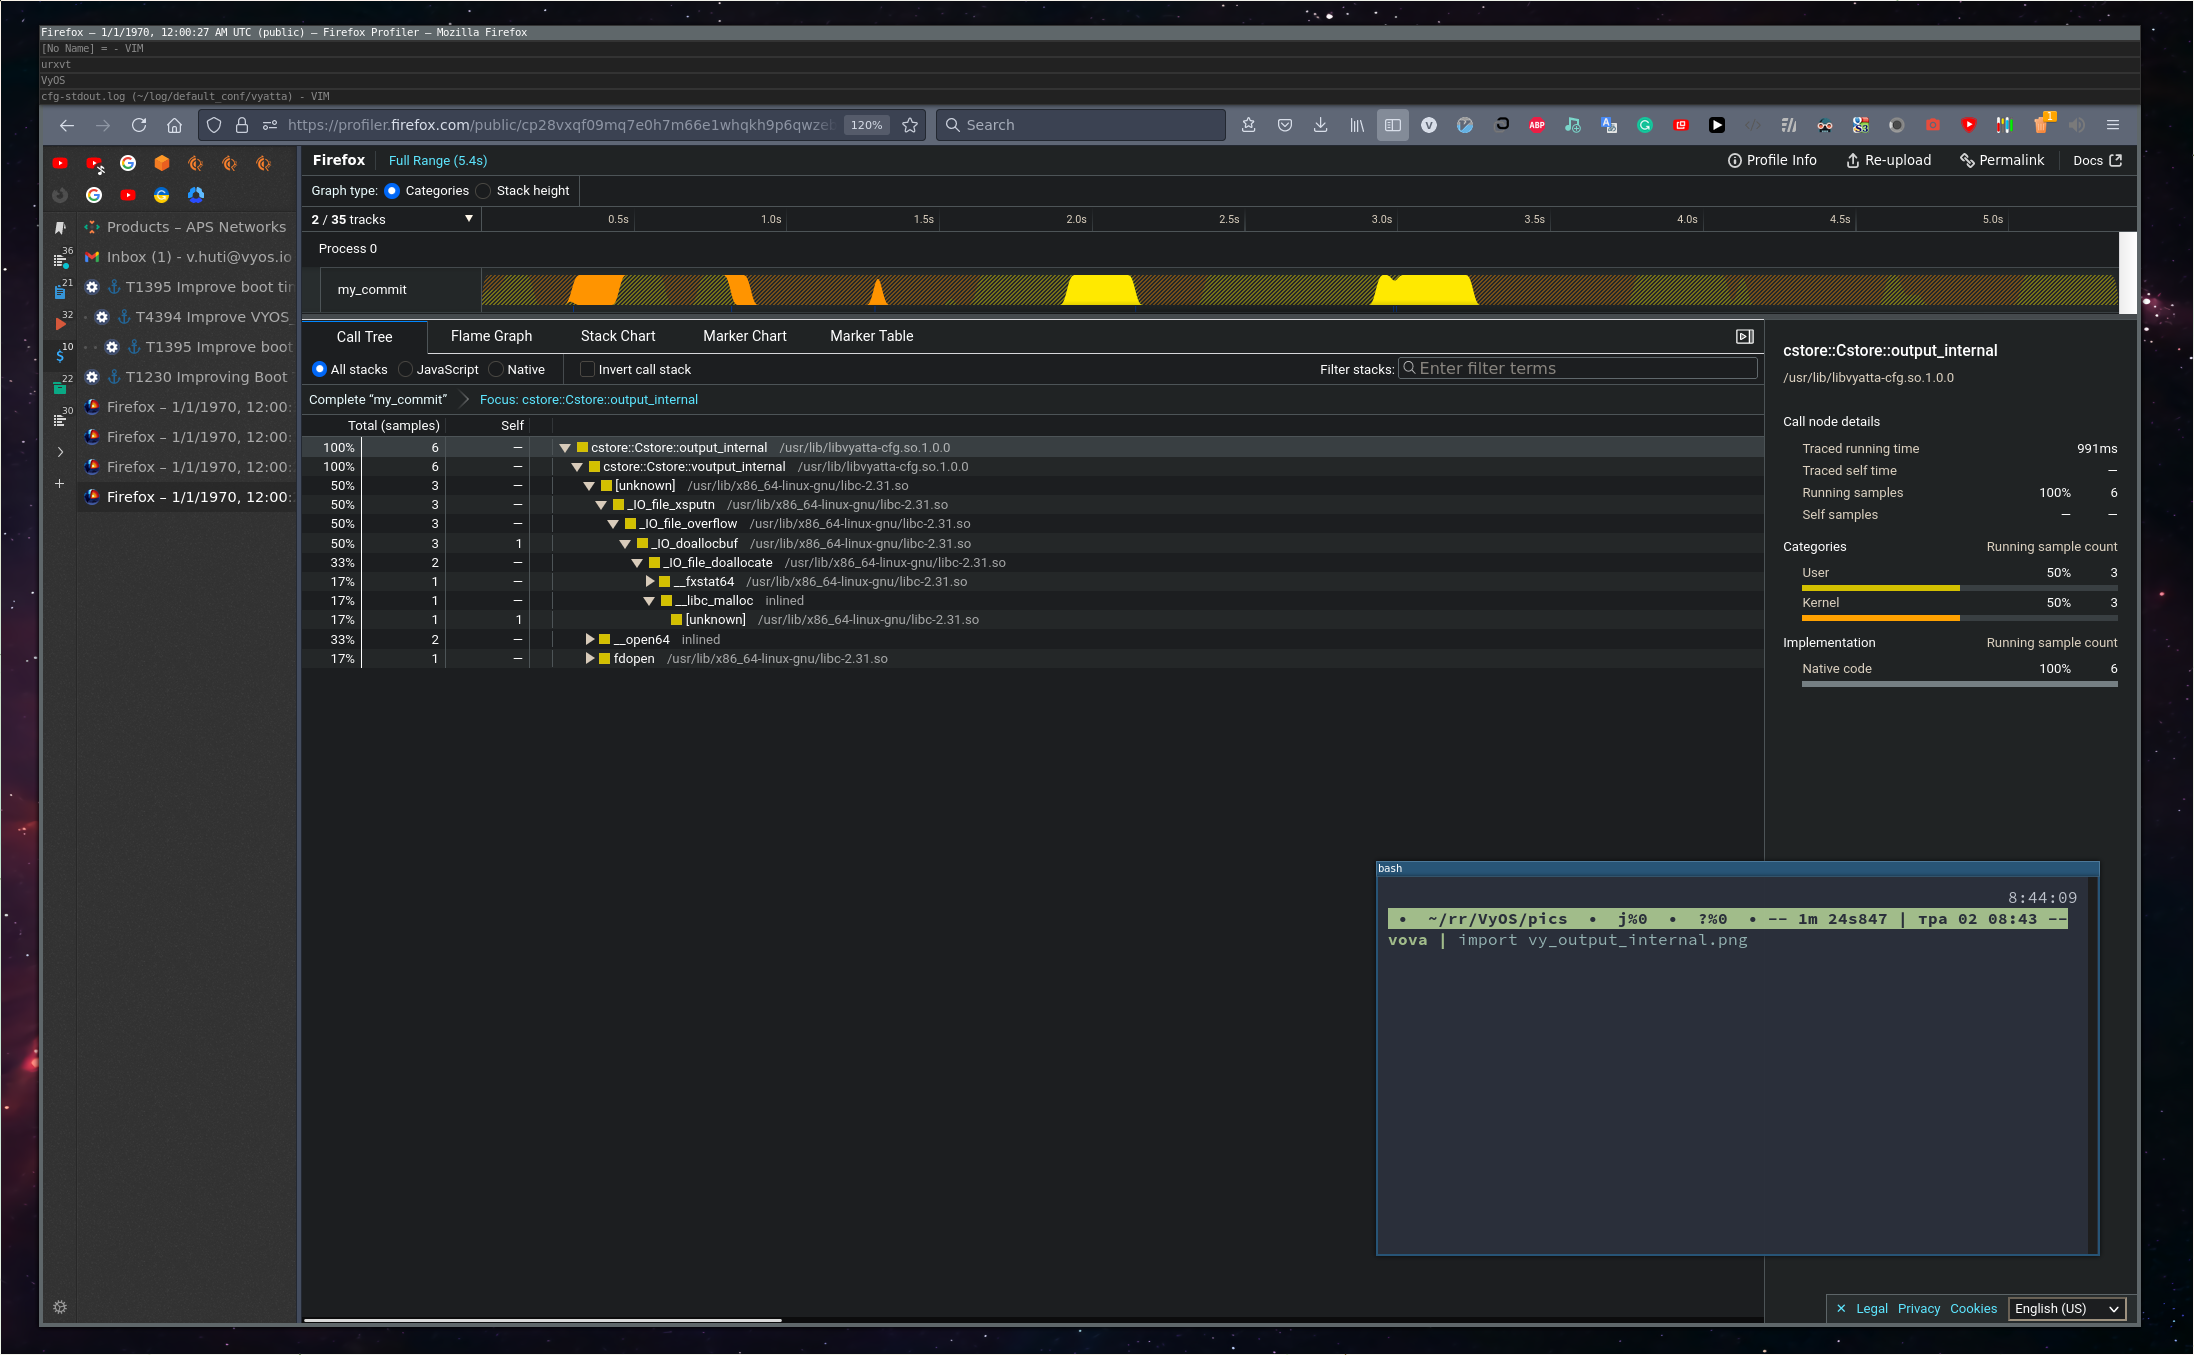
After which you should see the traced time in the log:

cat /var/log/vyatta/cfg-stdout.log
-------------------------------------
Action for " test 123 " took 1.011 sec to execute
cp[/opt/vyatta/config/tmp/new_config_9203]->[/opt/vyatta/config/tmp/tmp_9203/work]
no tap[/opt/vyatta/config/tmp/tmp_9203/active]
cp[/opt/vyatta/config/tmp/new_config_9203]->[/opt/vyatta/config/tmp/tmp_9203/active]

I have verified one more scenario, sleeping 1 min instead of 1 sec. The result was correct:

[edit]
vyos@vyos# set test 150

  + sleep 61
  + /usr/libexec/vyos/validate-value --exec '/usr/libexec/vyos/validators/numeric --range 1-200' --value 150

[edit]
vyos@vyos# commit
[ test 150 ]
+ sleep 61
+ /usr/libexec/vyos/validate-value --exec '/usr/libexec/vyos/validators/numeric --range 1-200' --value 150

Traced time in the log:

cat /var/log/vyatta/cfg-stdout.log
-------------------------------------------------
Action for " test 150 " took 61.013 sec to execute
cp[/opt/vyatta/config/tmp/new_config_9203]->[/opt/vyatta/config/tmp/tmp_9203/work]
no tap[/opt/vyatta/config/tmp/tmp_9203/active]
cp[/opt/vyatta/config/tmp/new_config_9203]->[/opt/vyatta/config/tmp/tmp_9203/active]
NOTE: this tracks only the executed commands and ignores the configuration parsing, fs managment, etc...

For advanced analysis, you can collect perf samples for a flamegraph.

  1. Compile package with debug symbols present and install
export CFLAGS=" -fno-omit-frame-pointer -O0 -g -ggdb  -rdynamic -no-pie"  
export CXXFLAGS=" -fno-omit-frame-pointer -O0 -g -ggdb  -rdynamic -no-pie"
export CCASFLAGS=" -fno-omit-frame-pointer -O0 -g -ggdb  -rdynamic -no-pie"
debuild -i -us -uc -b
  1. Install perf tooling and edit init service to collect the data
/usr/libexec/vyos/init/vyos-router -> laod_bootfile():
---------------------------------------------------------------------------
sg ${GROUP} -c "perf record -g -F 999 --call-graph dwarf \
                    $vyos_libexec_dir/vyos-boot-config-loader.py $BOOTFFILE"
  1. Collect data afterwards - /data.perf
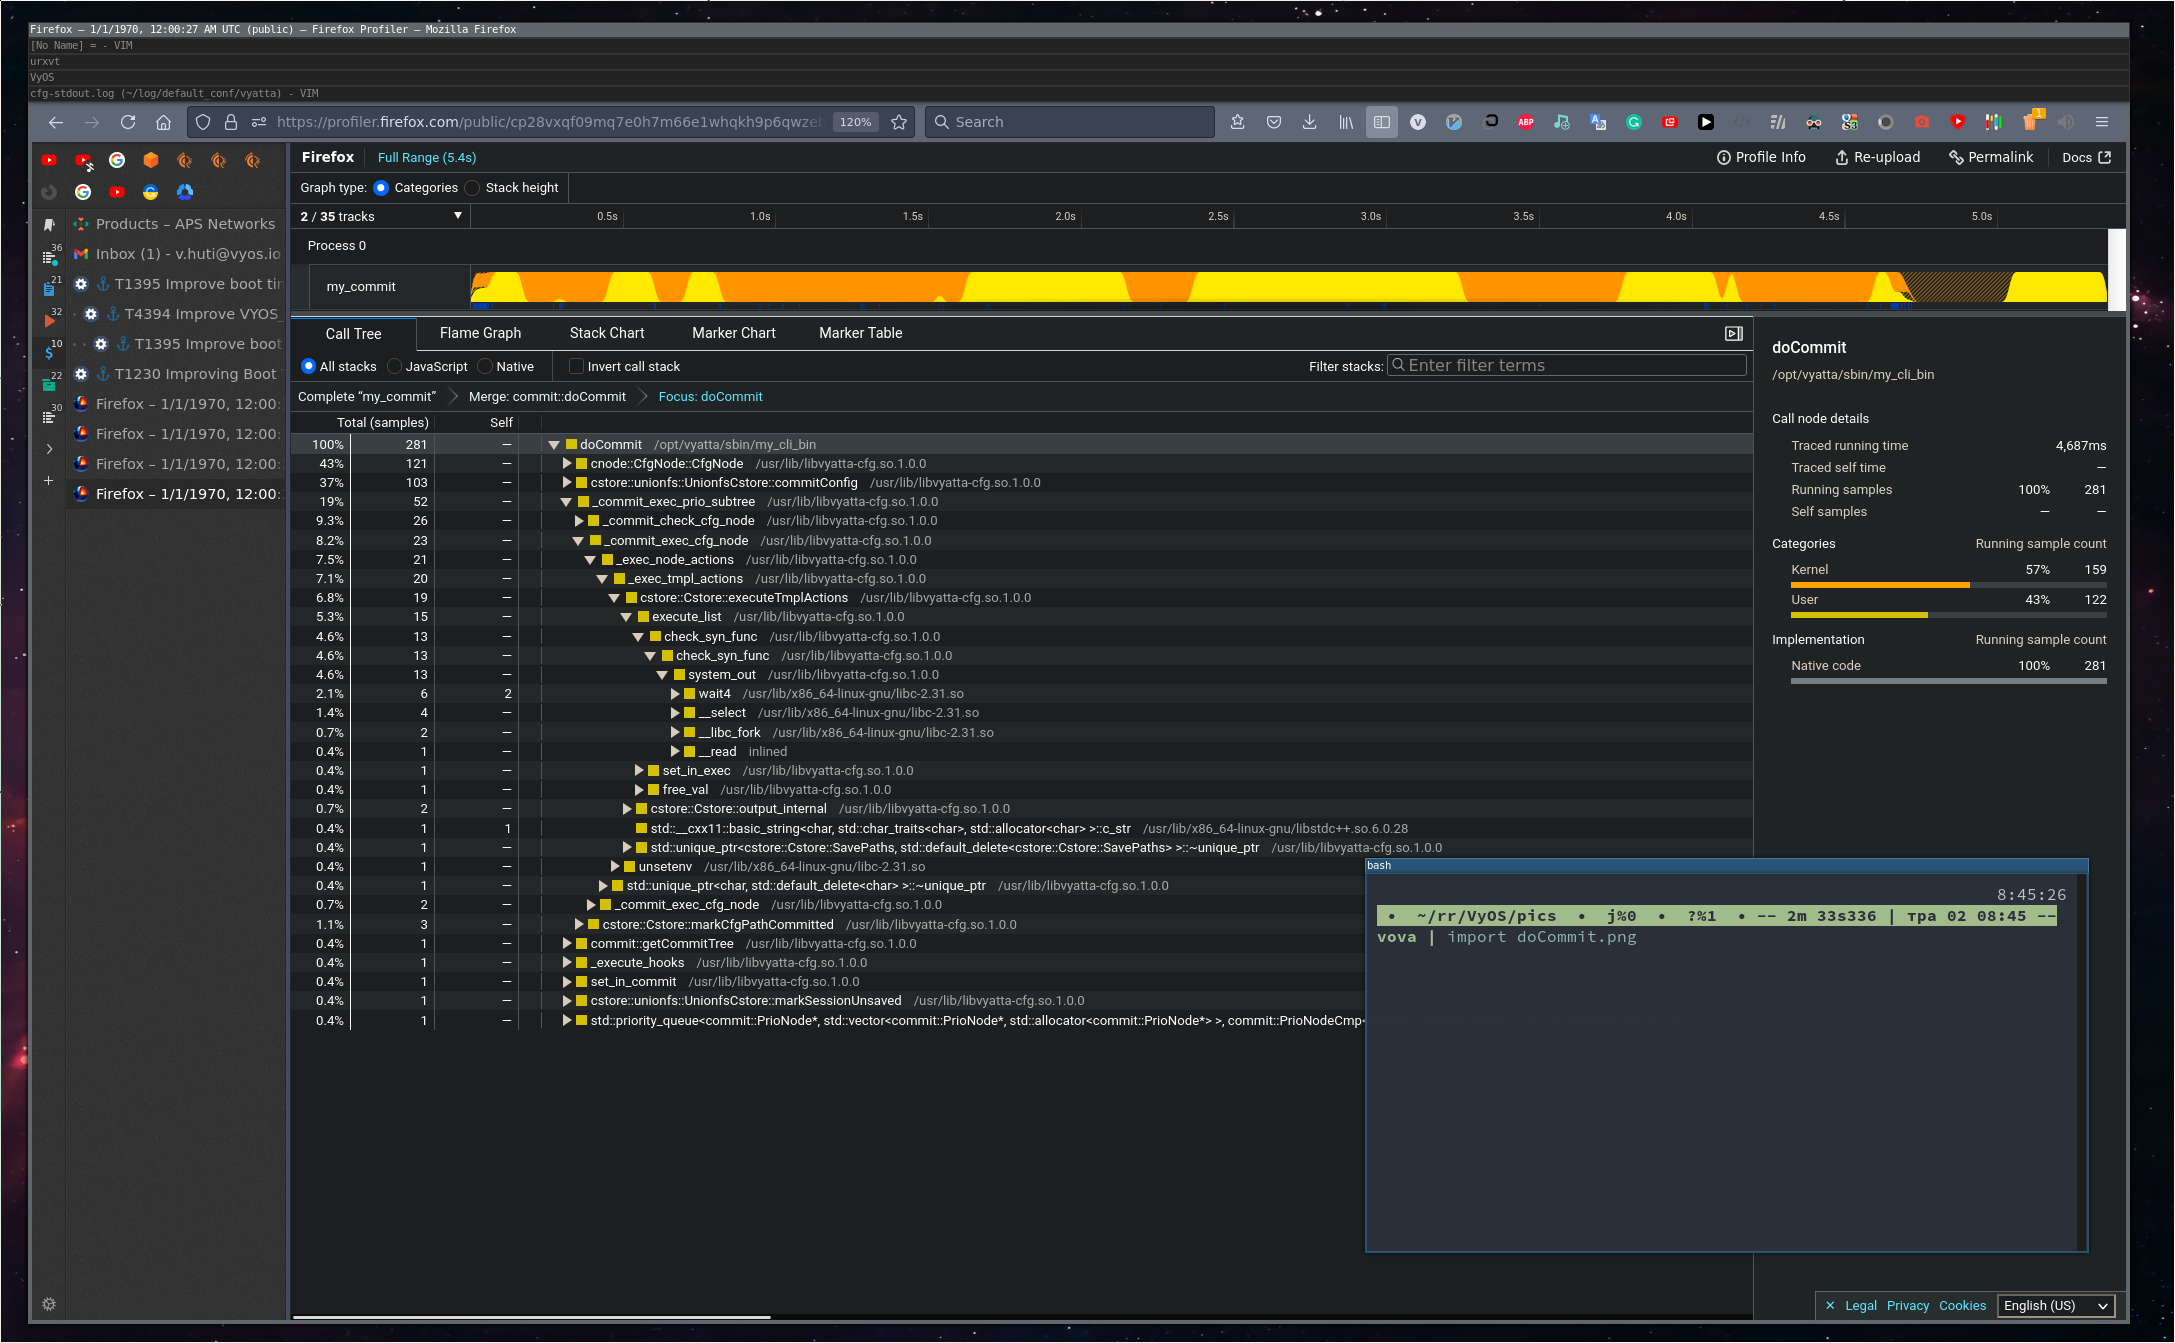
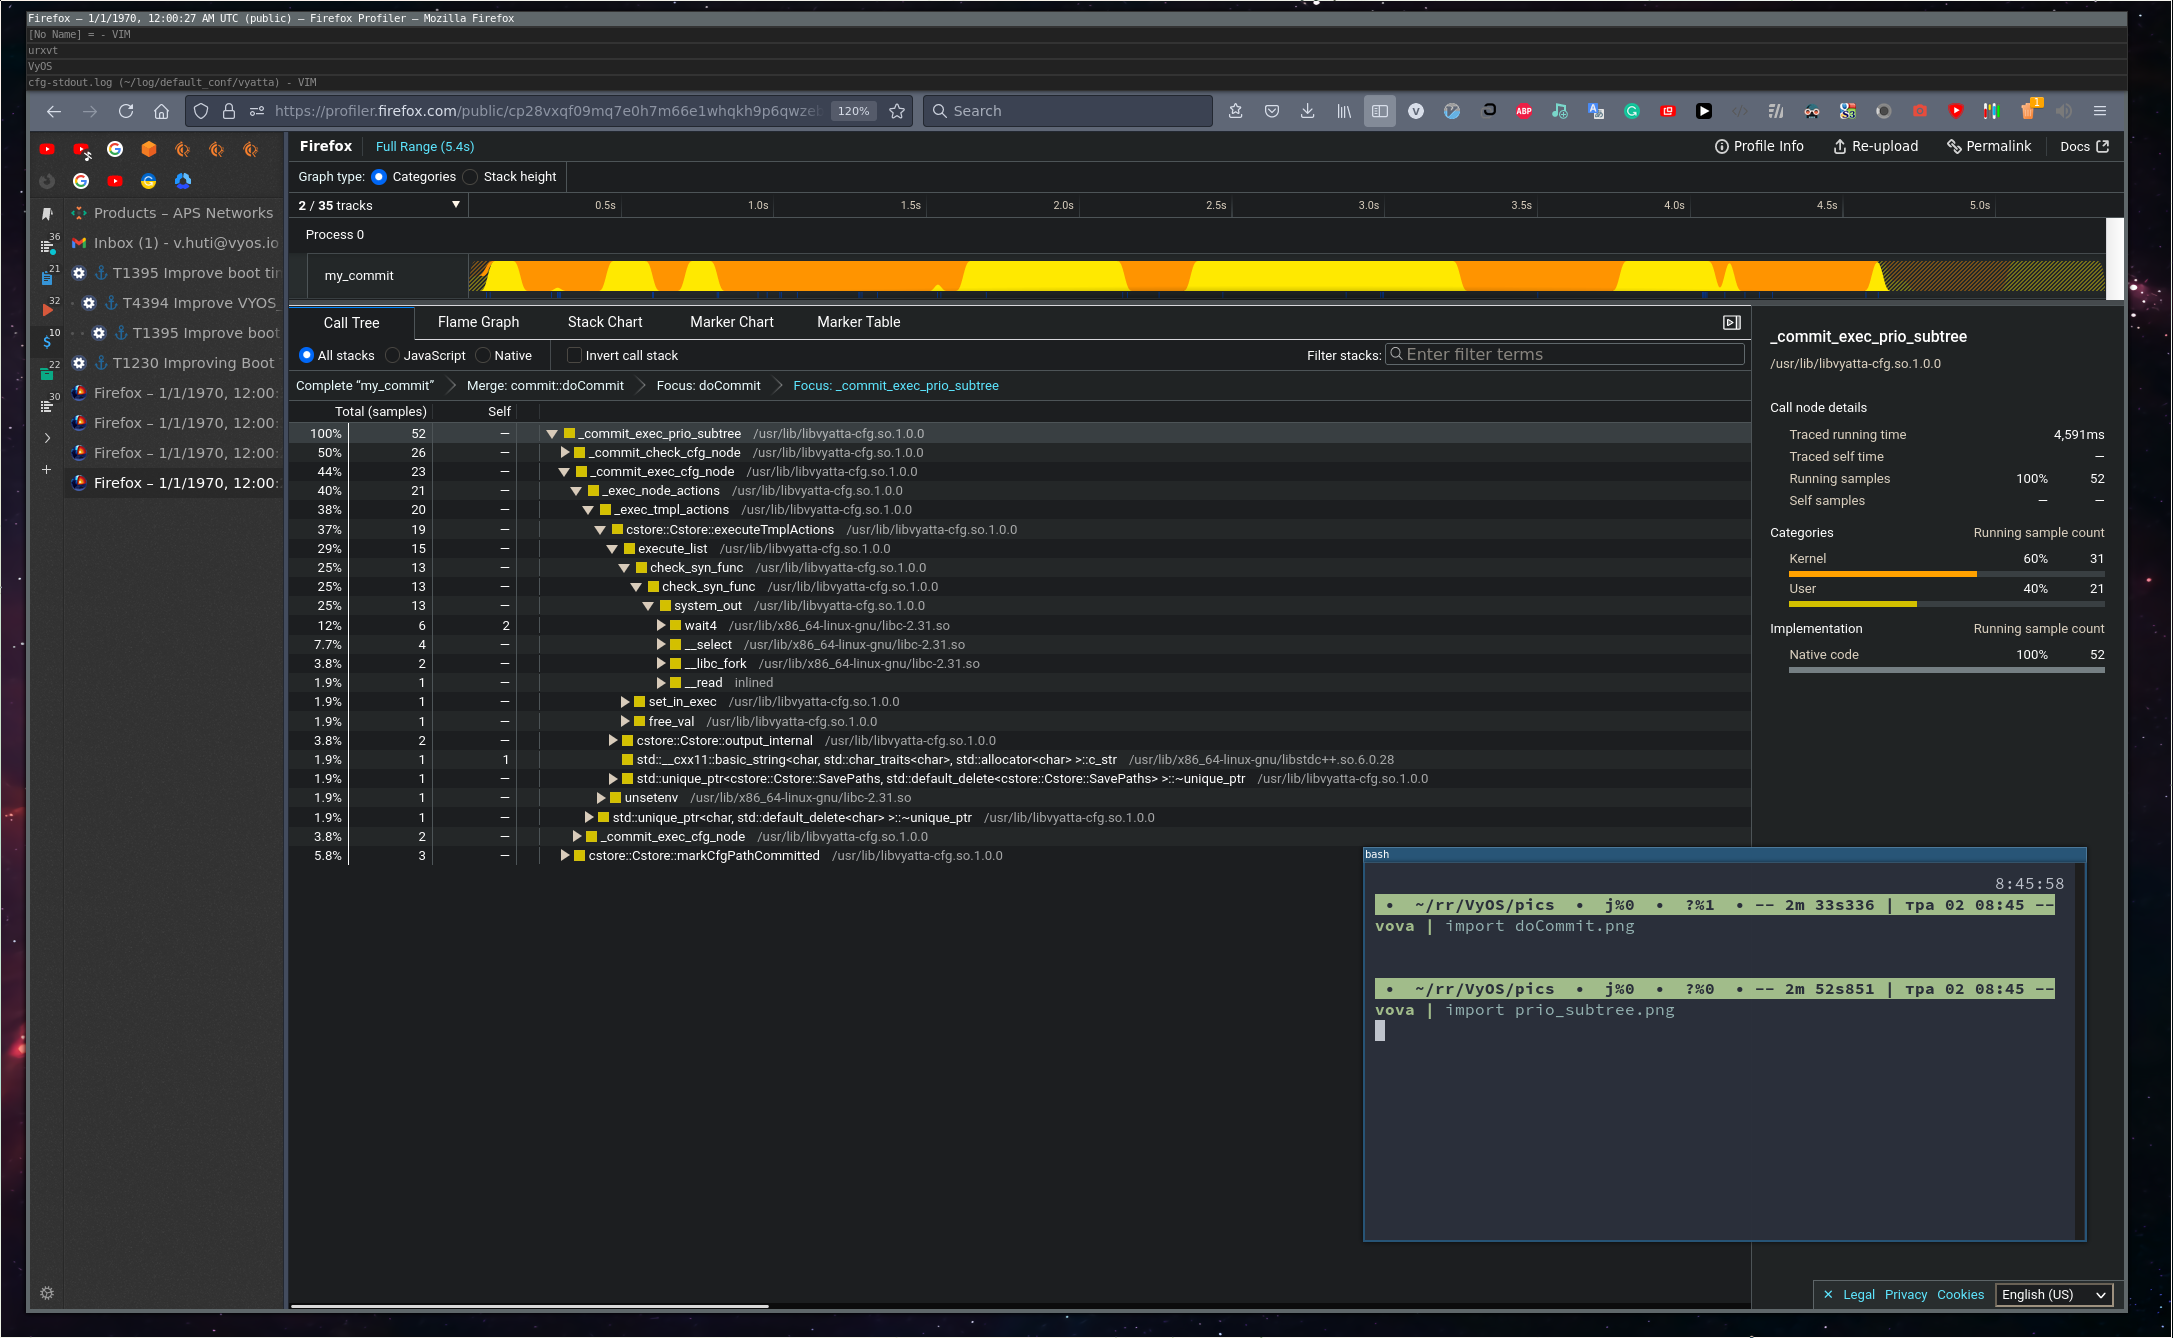
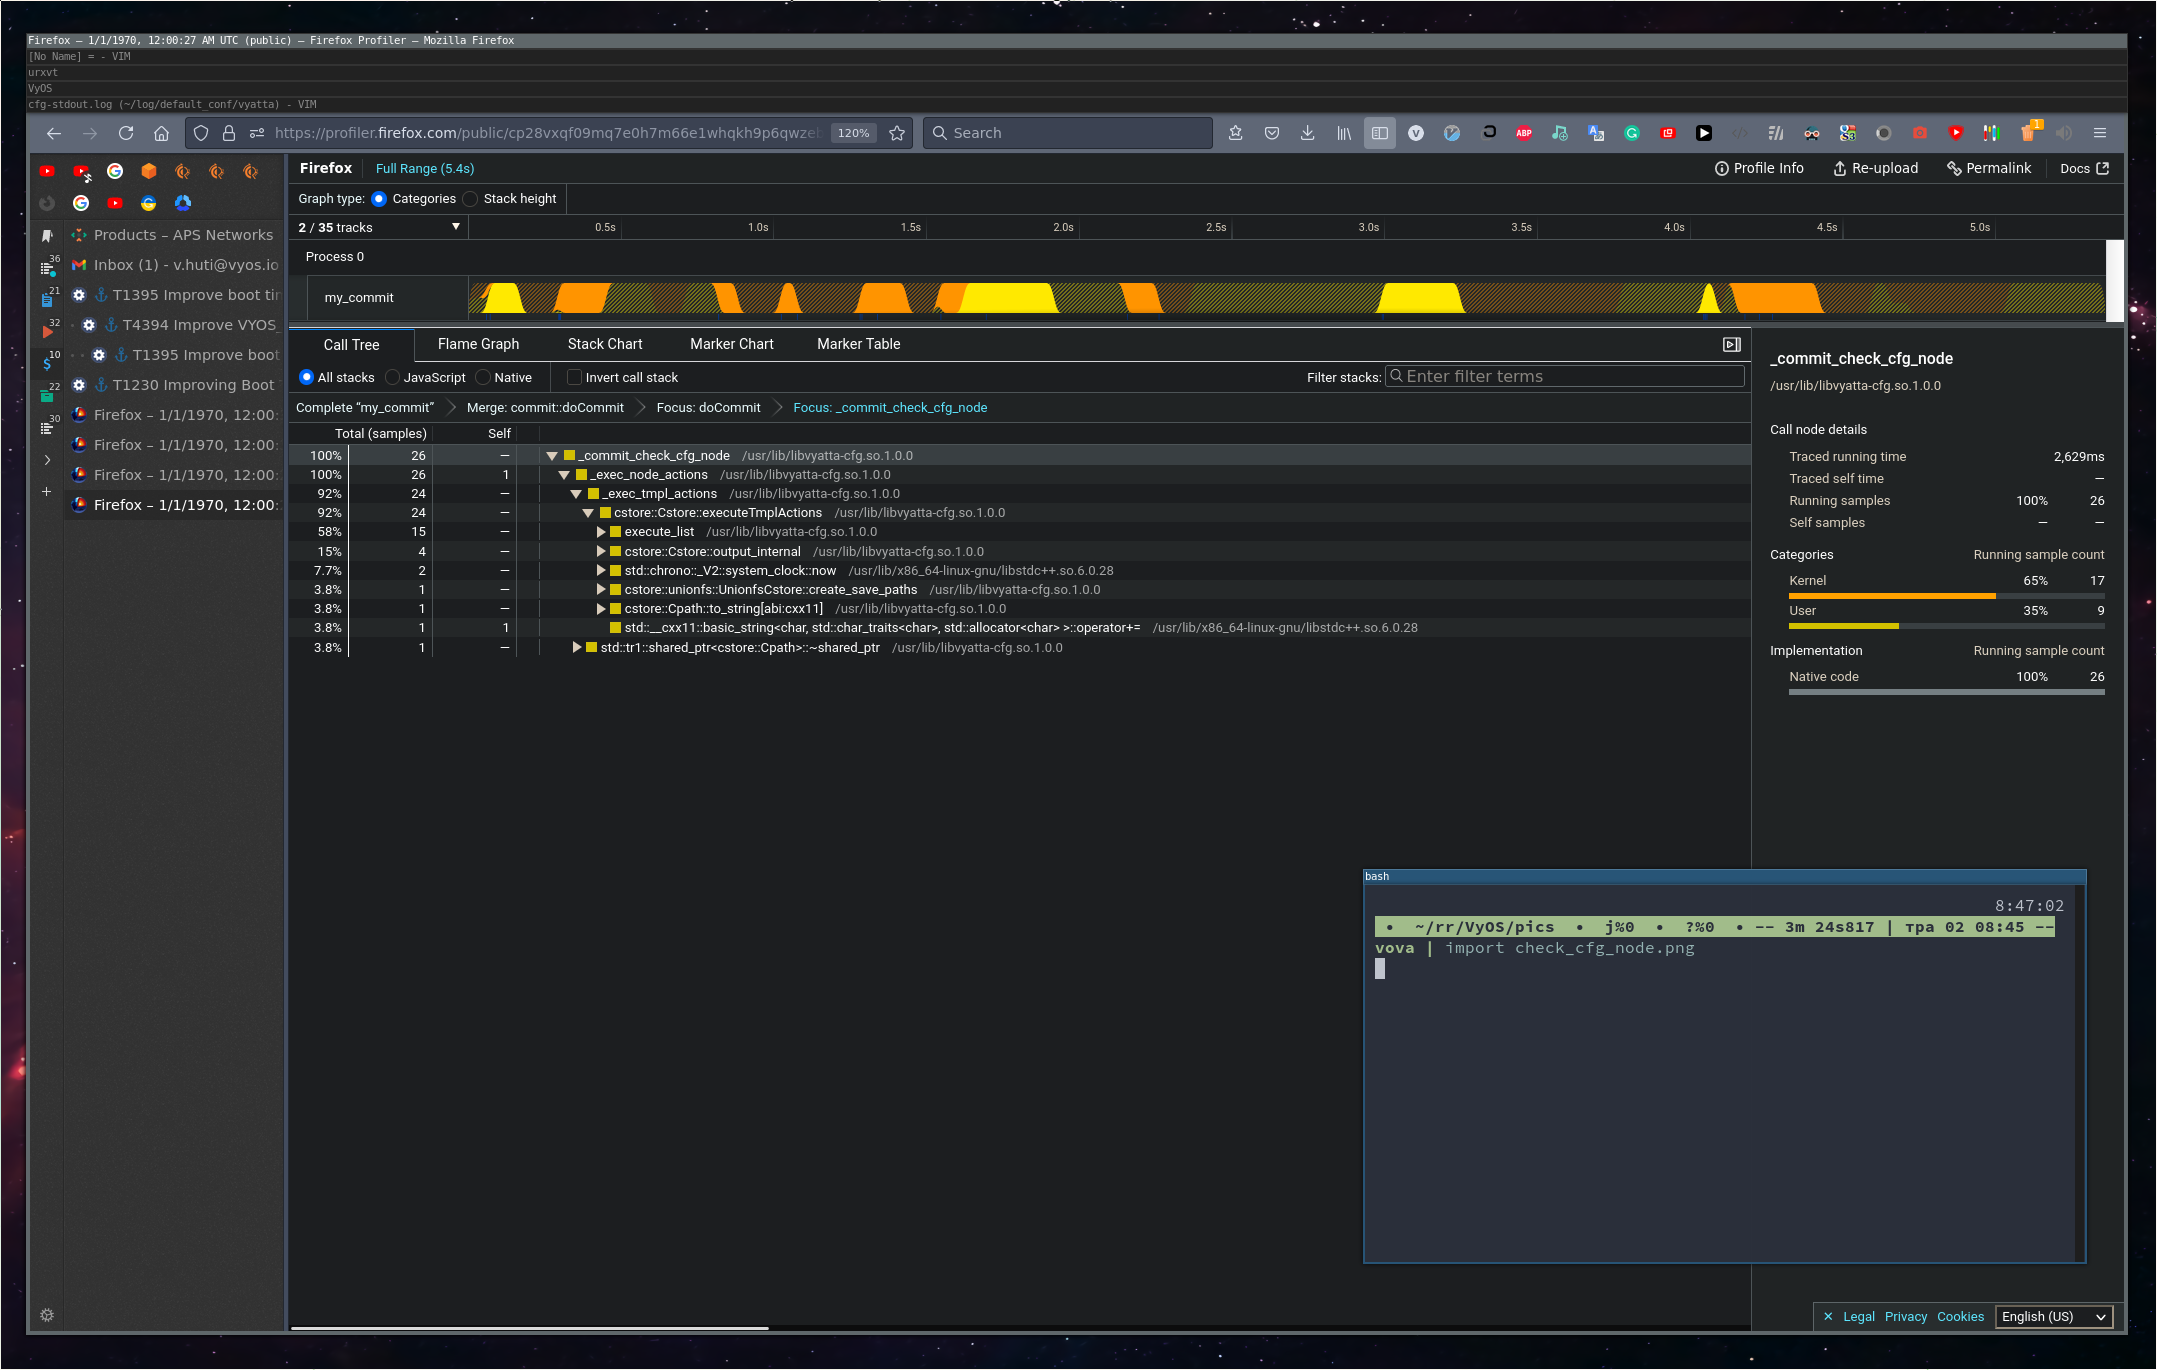
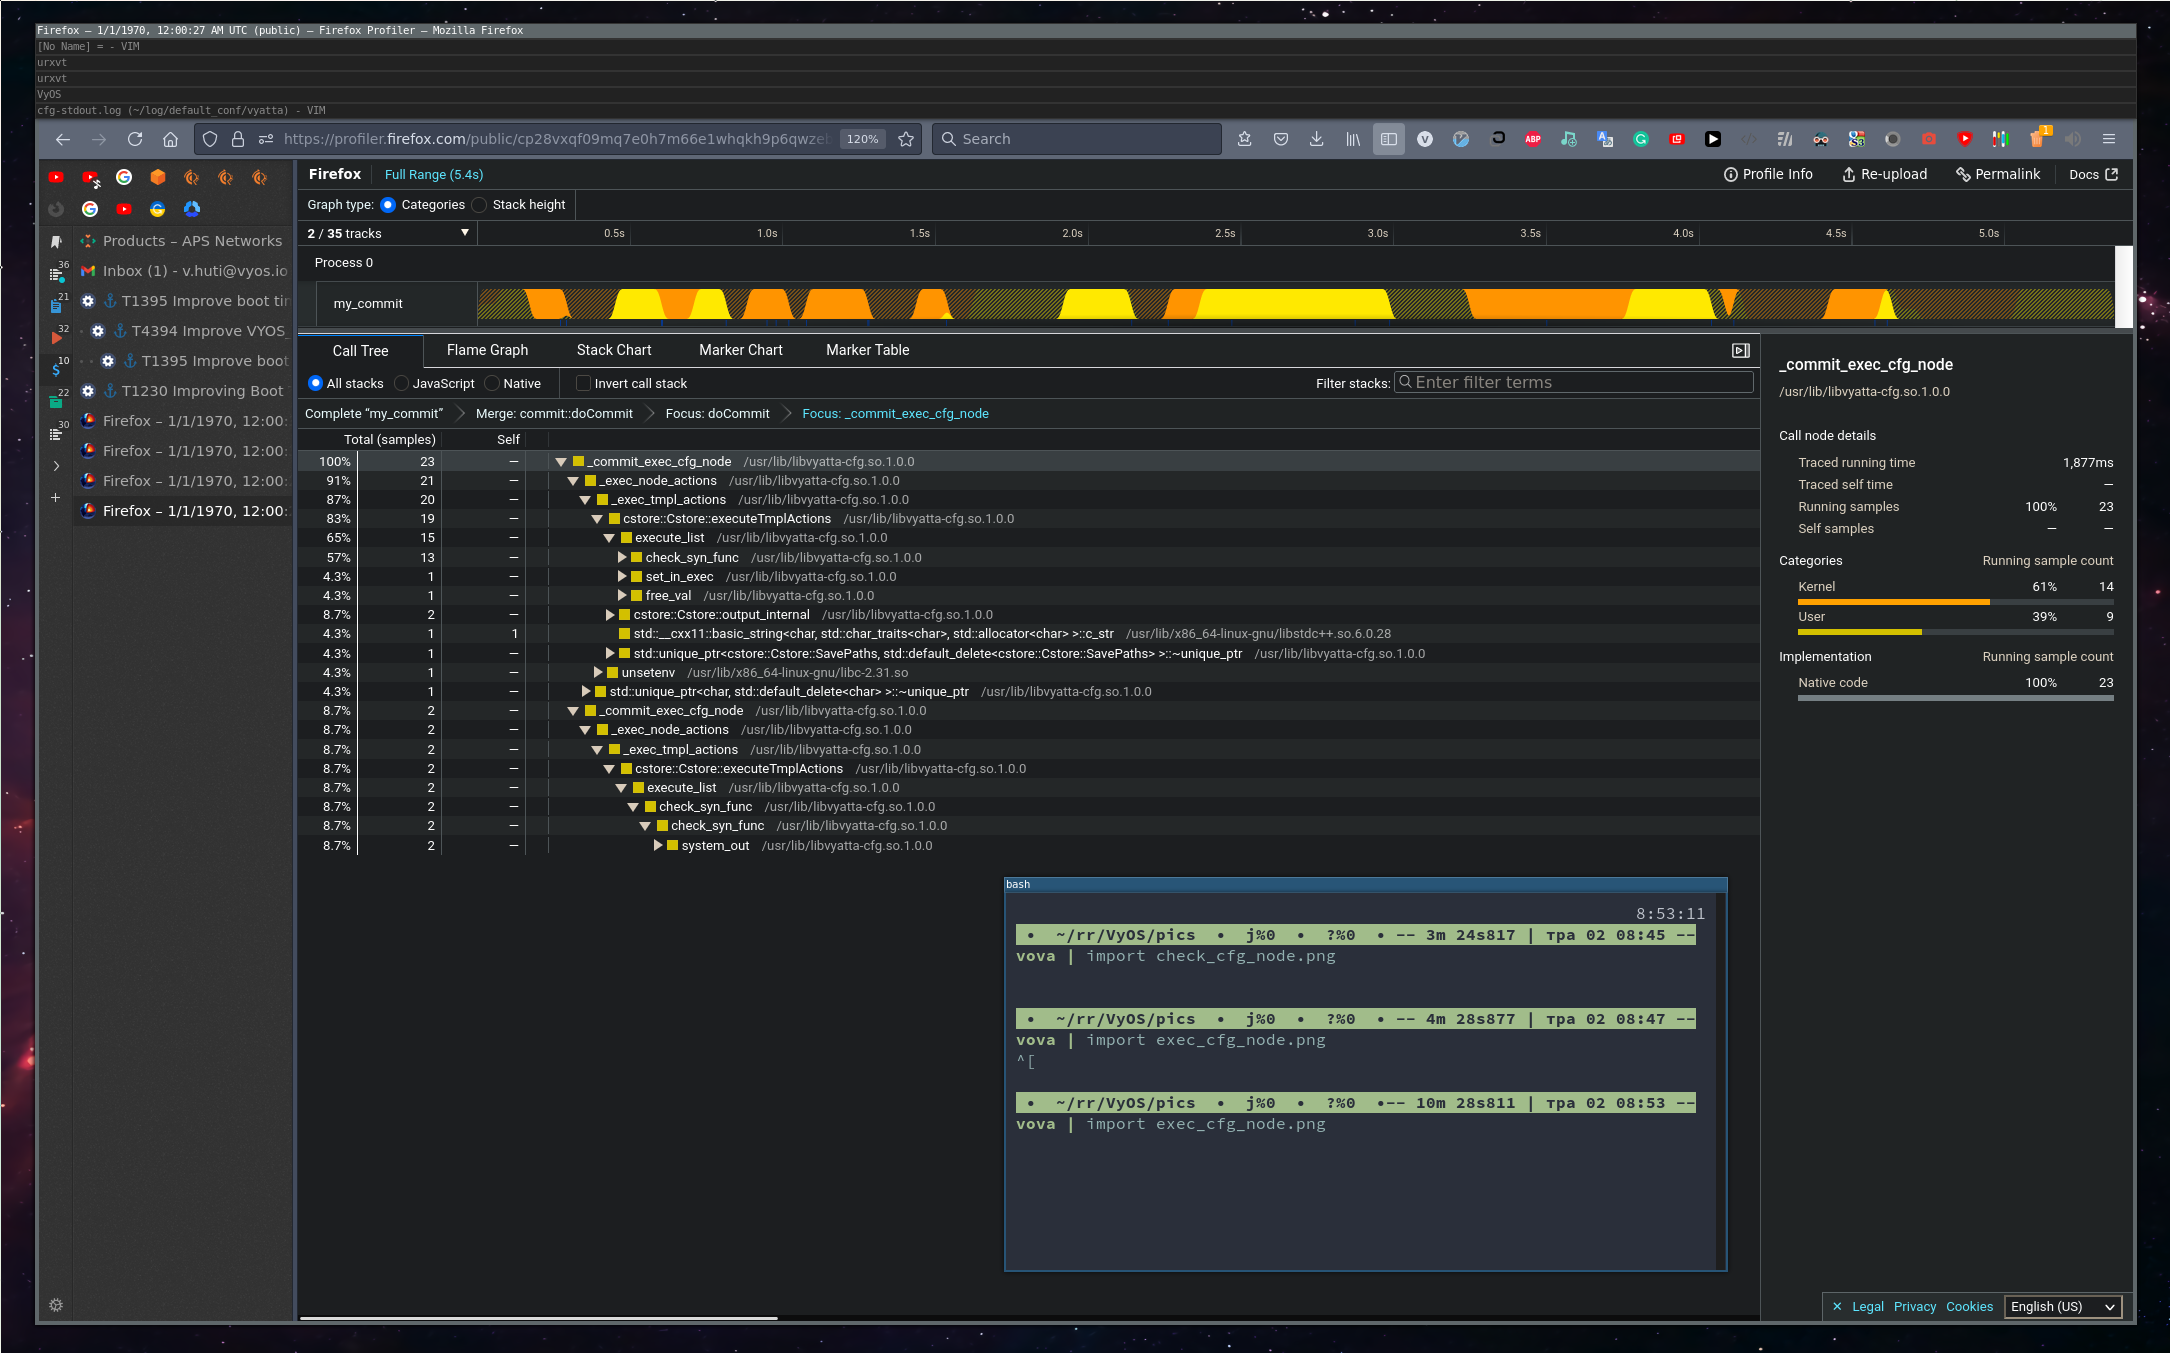
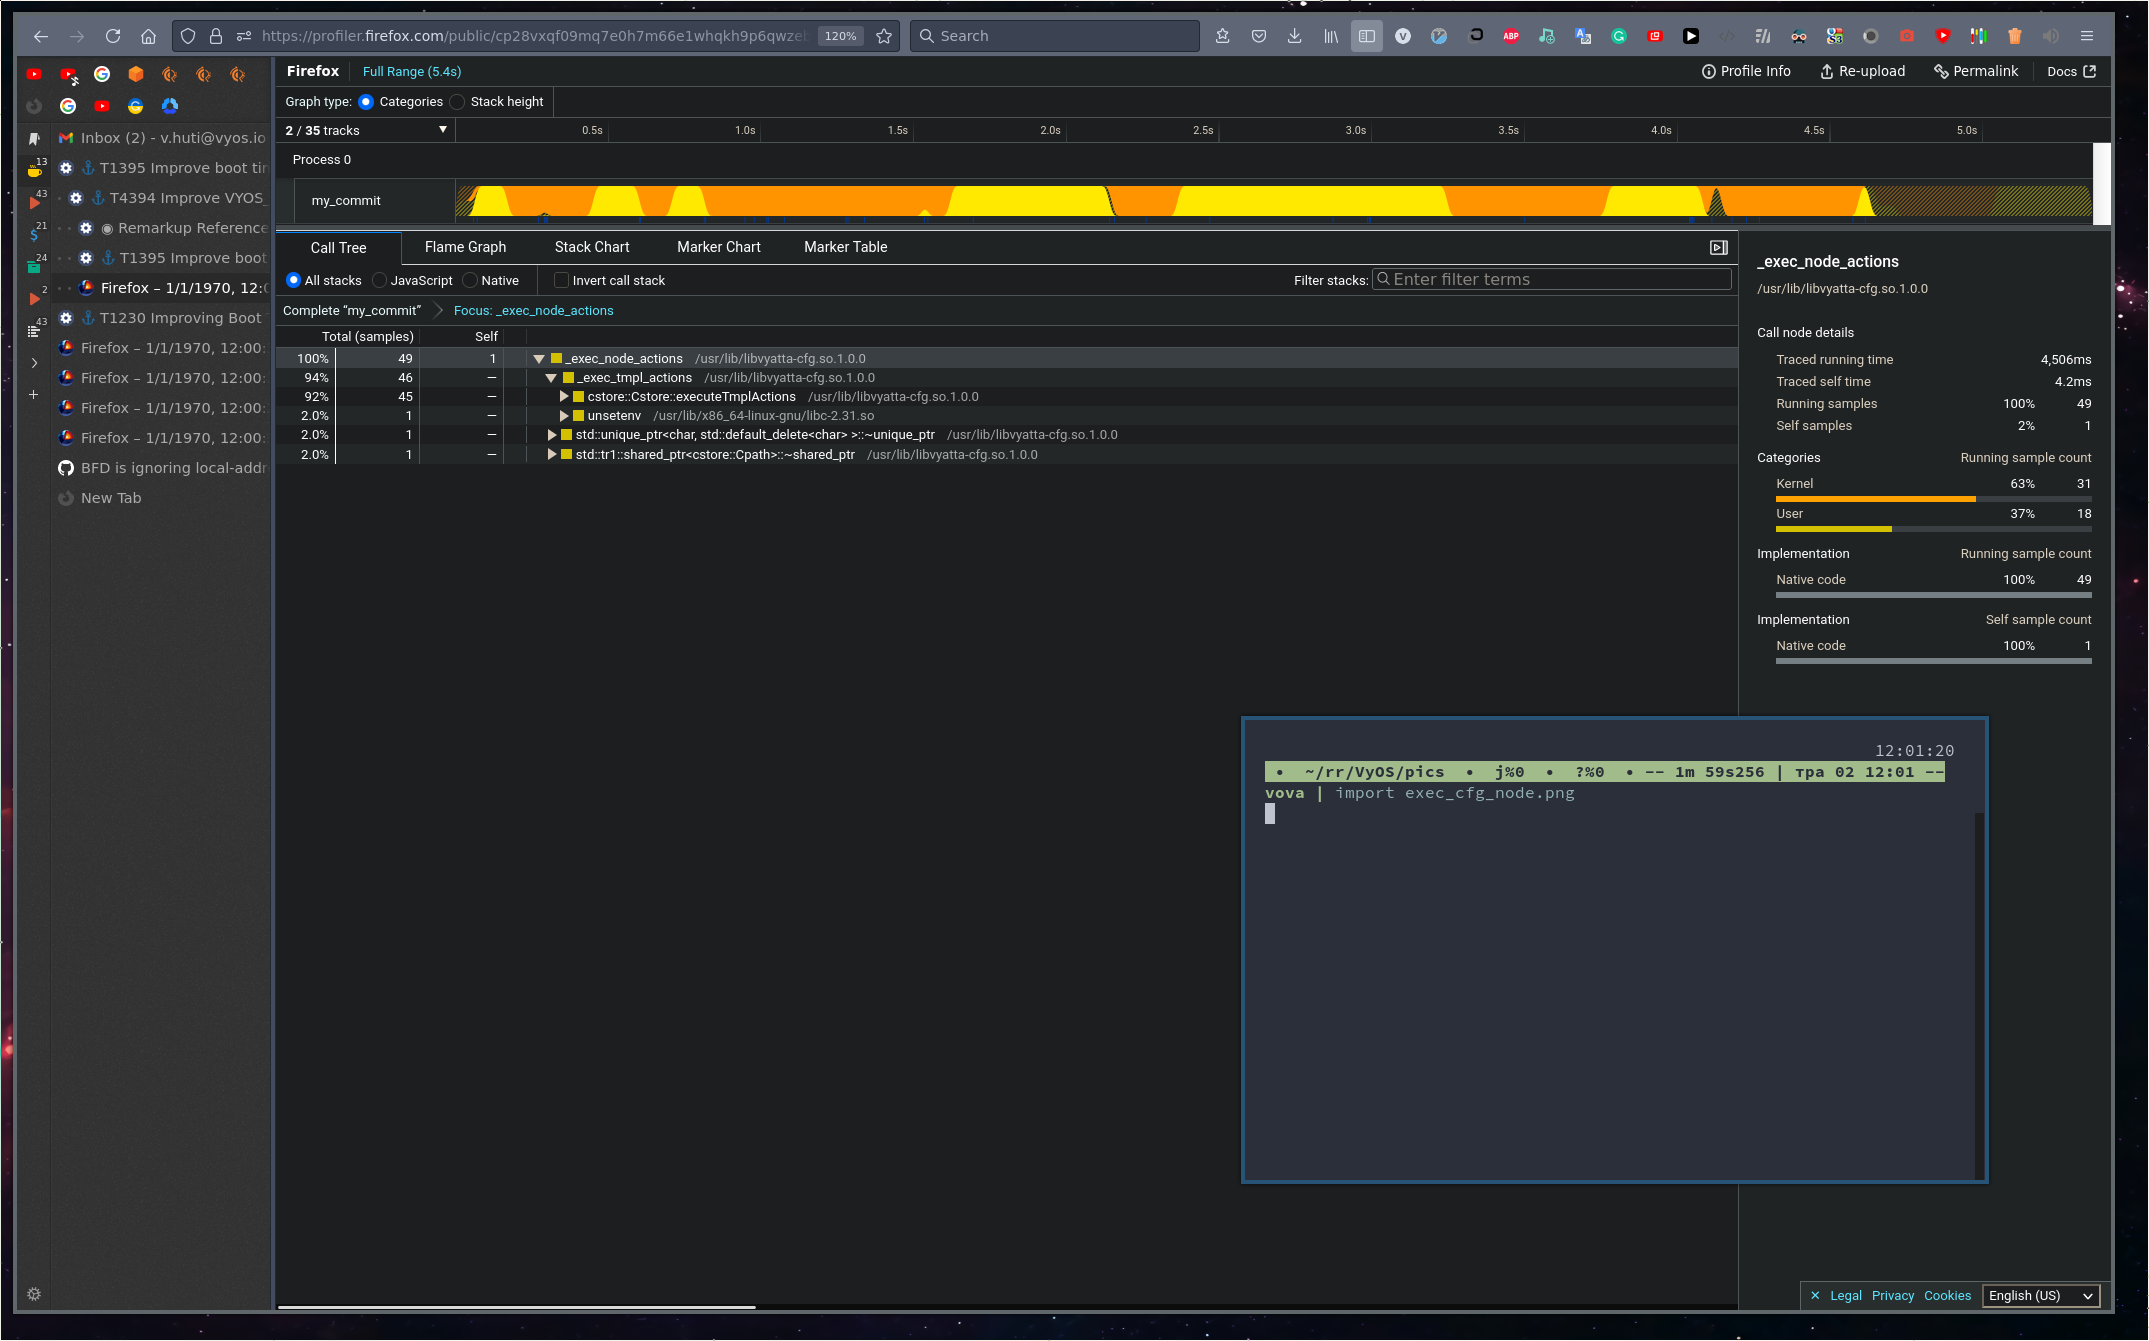
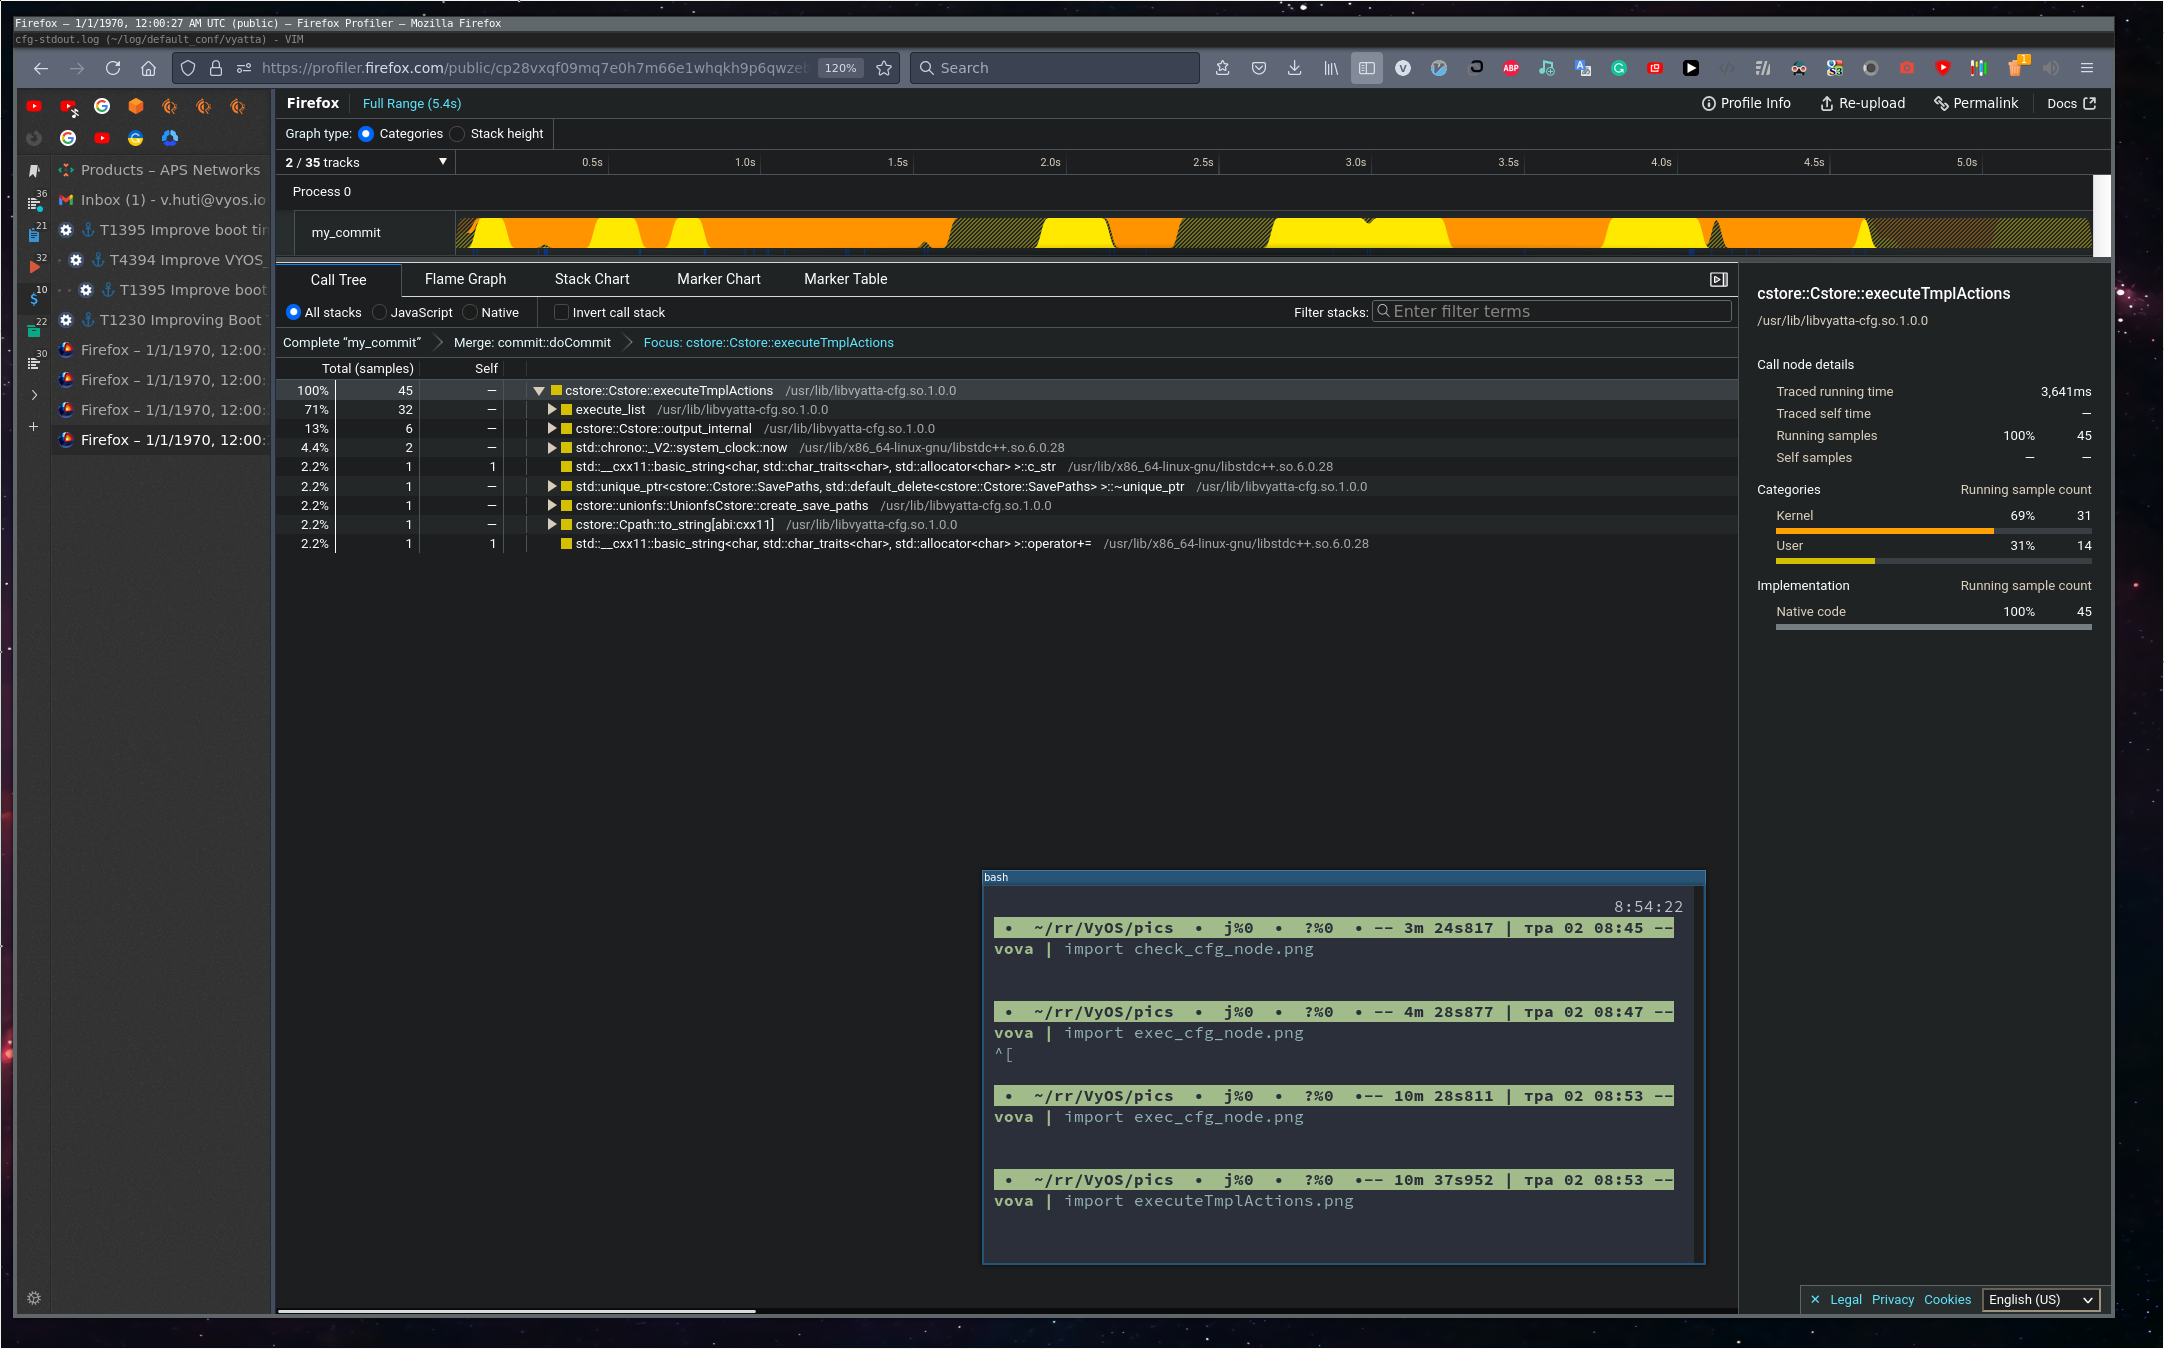
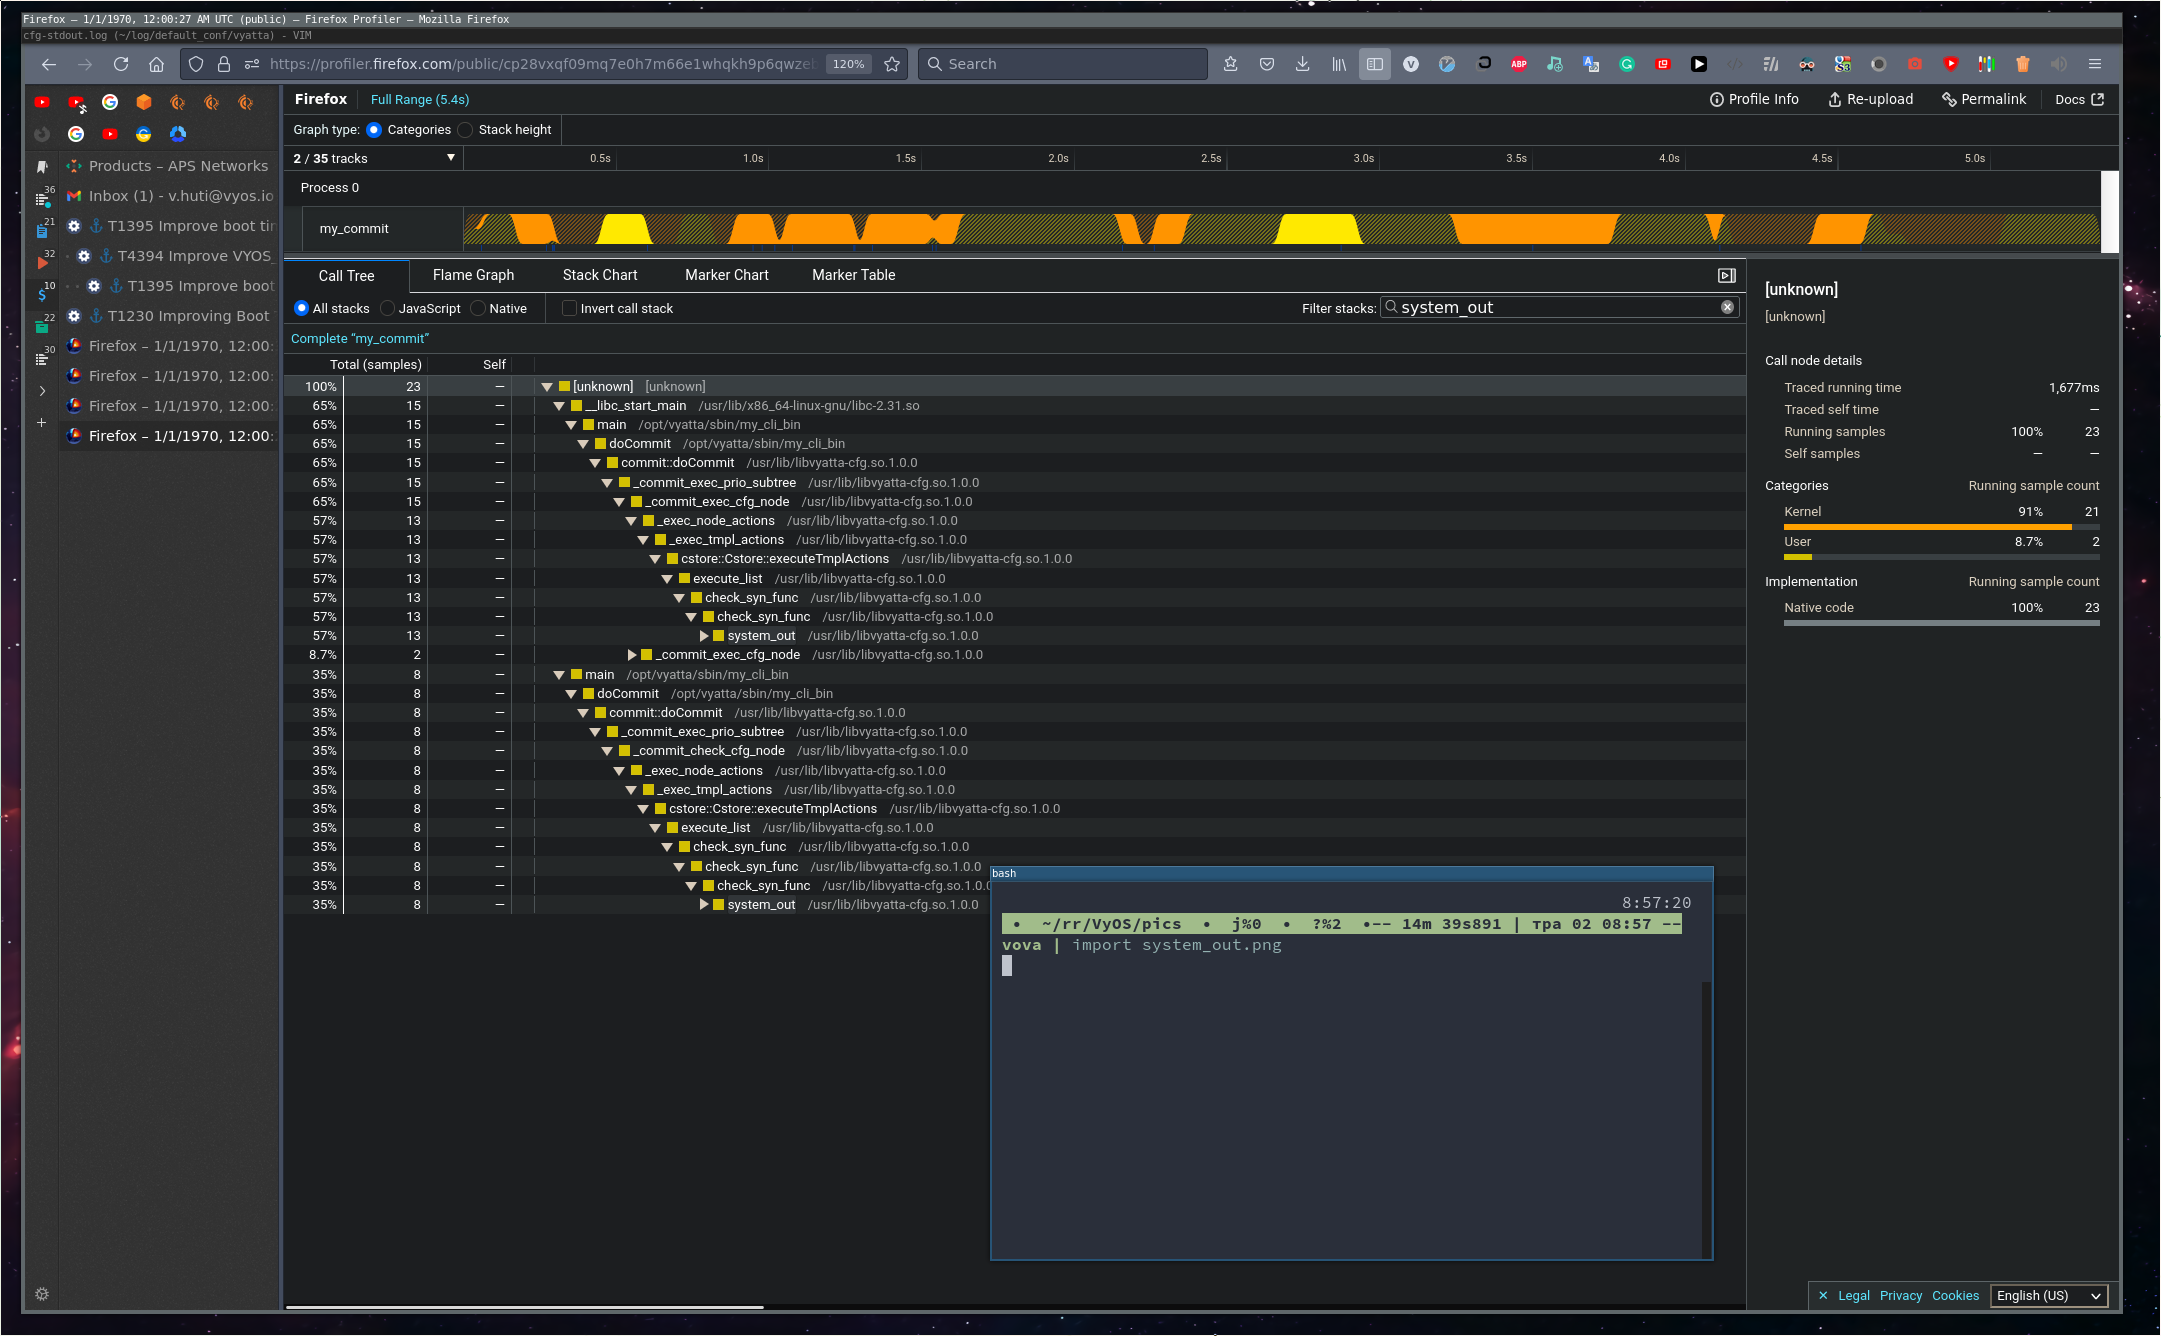
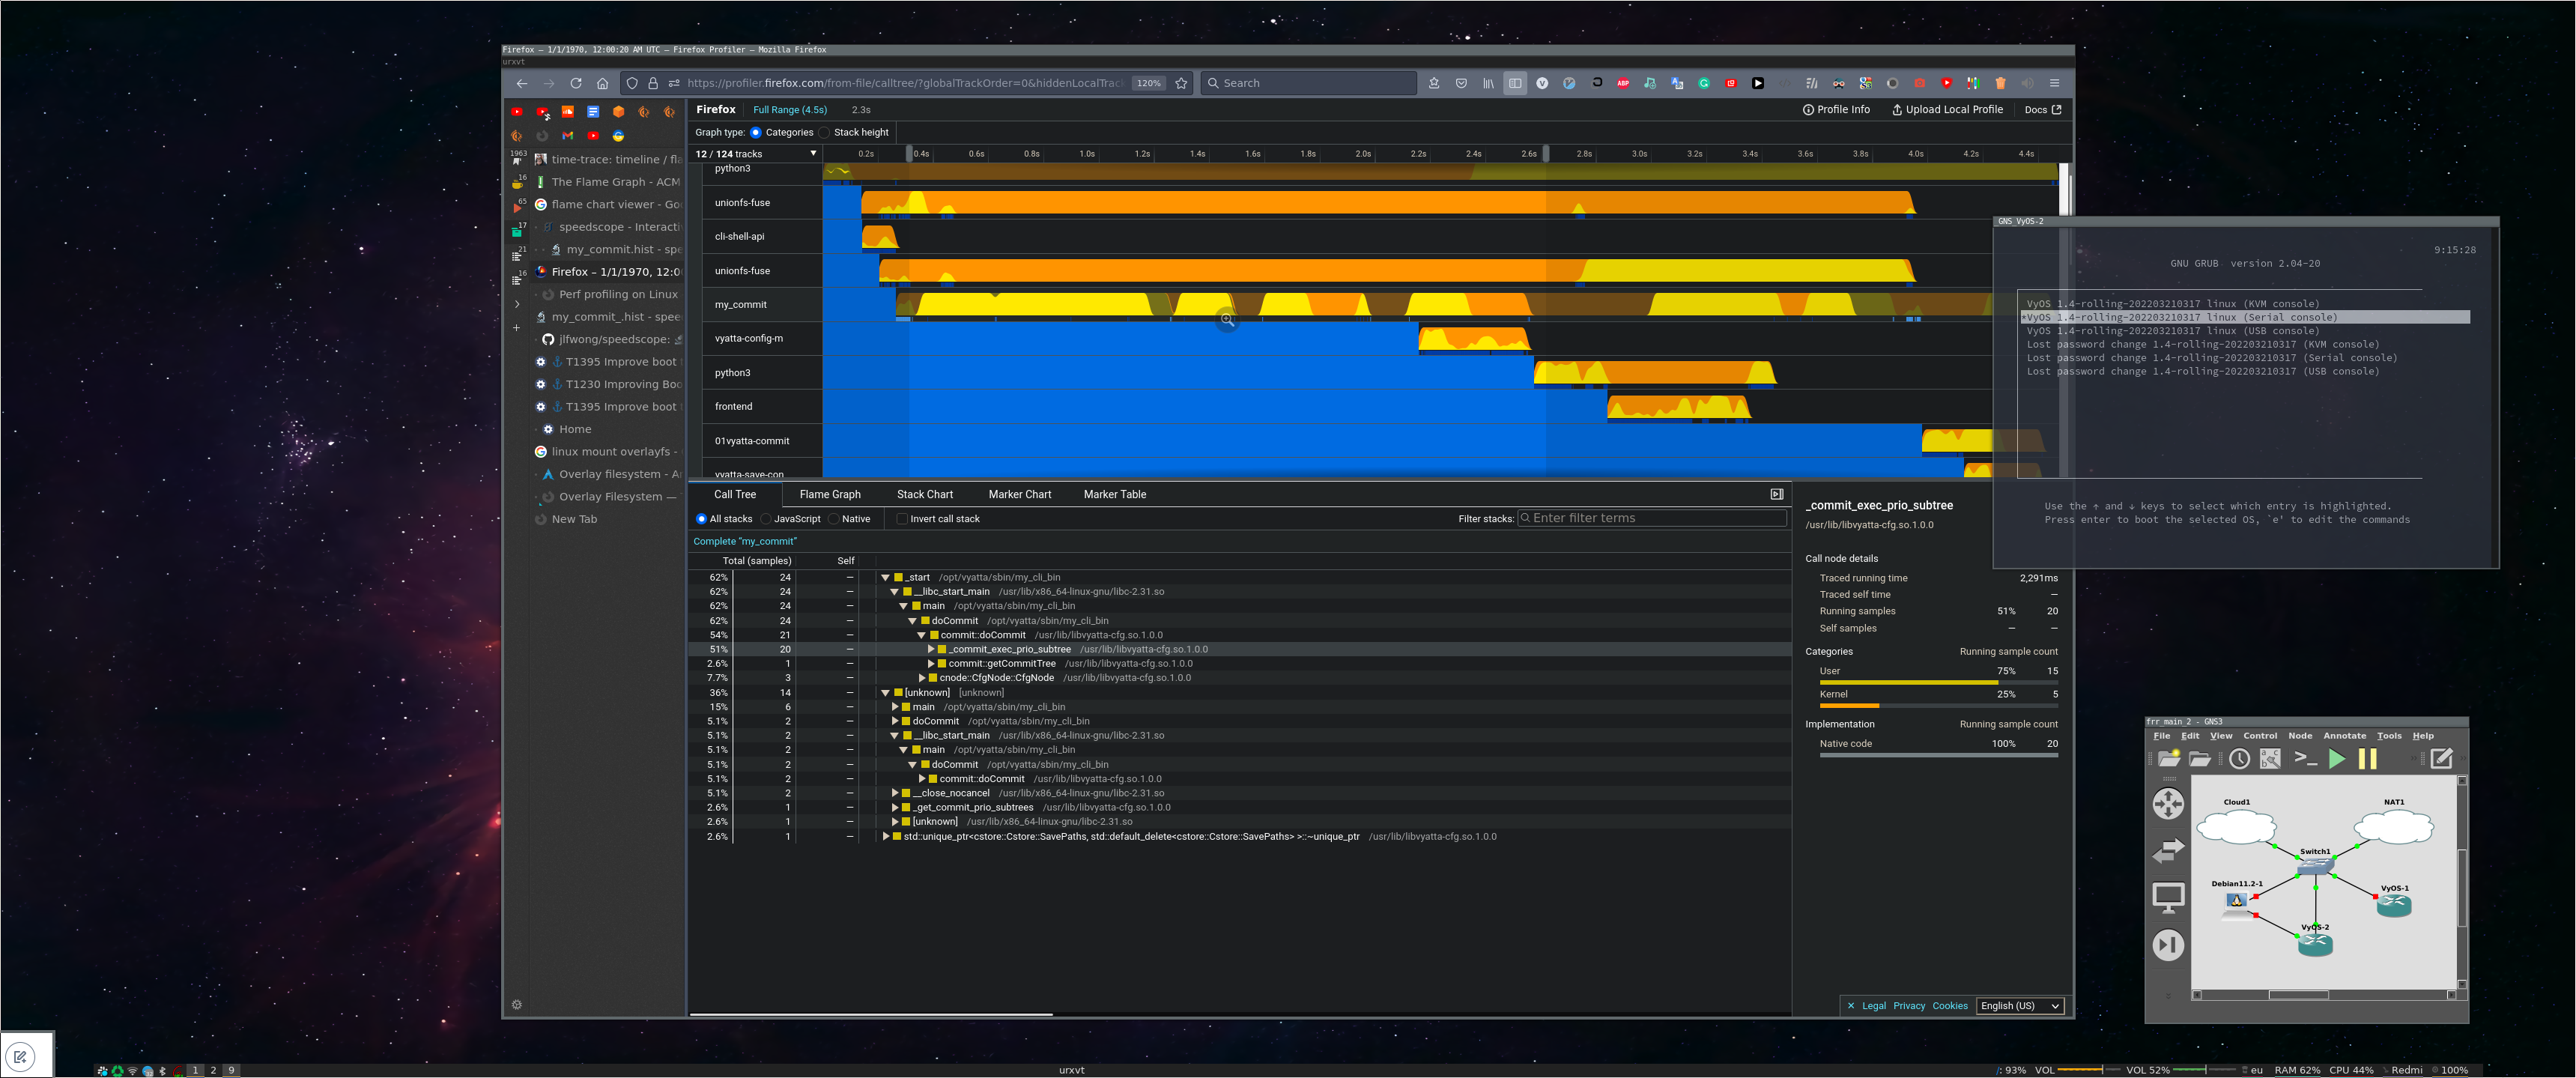
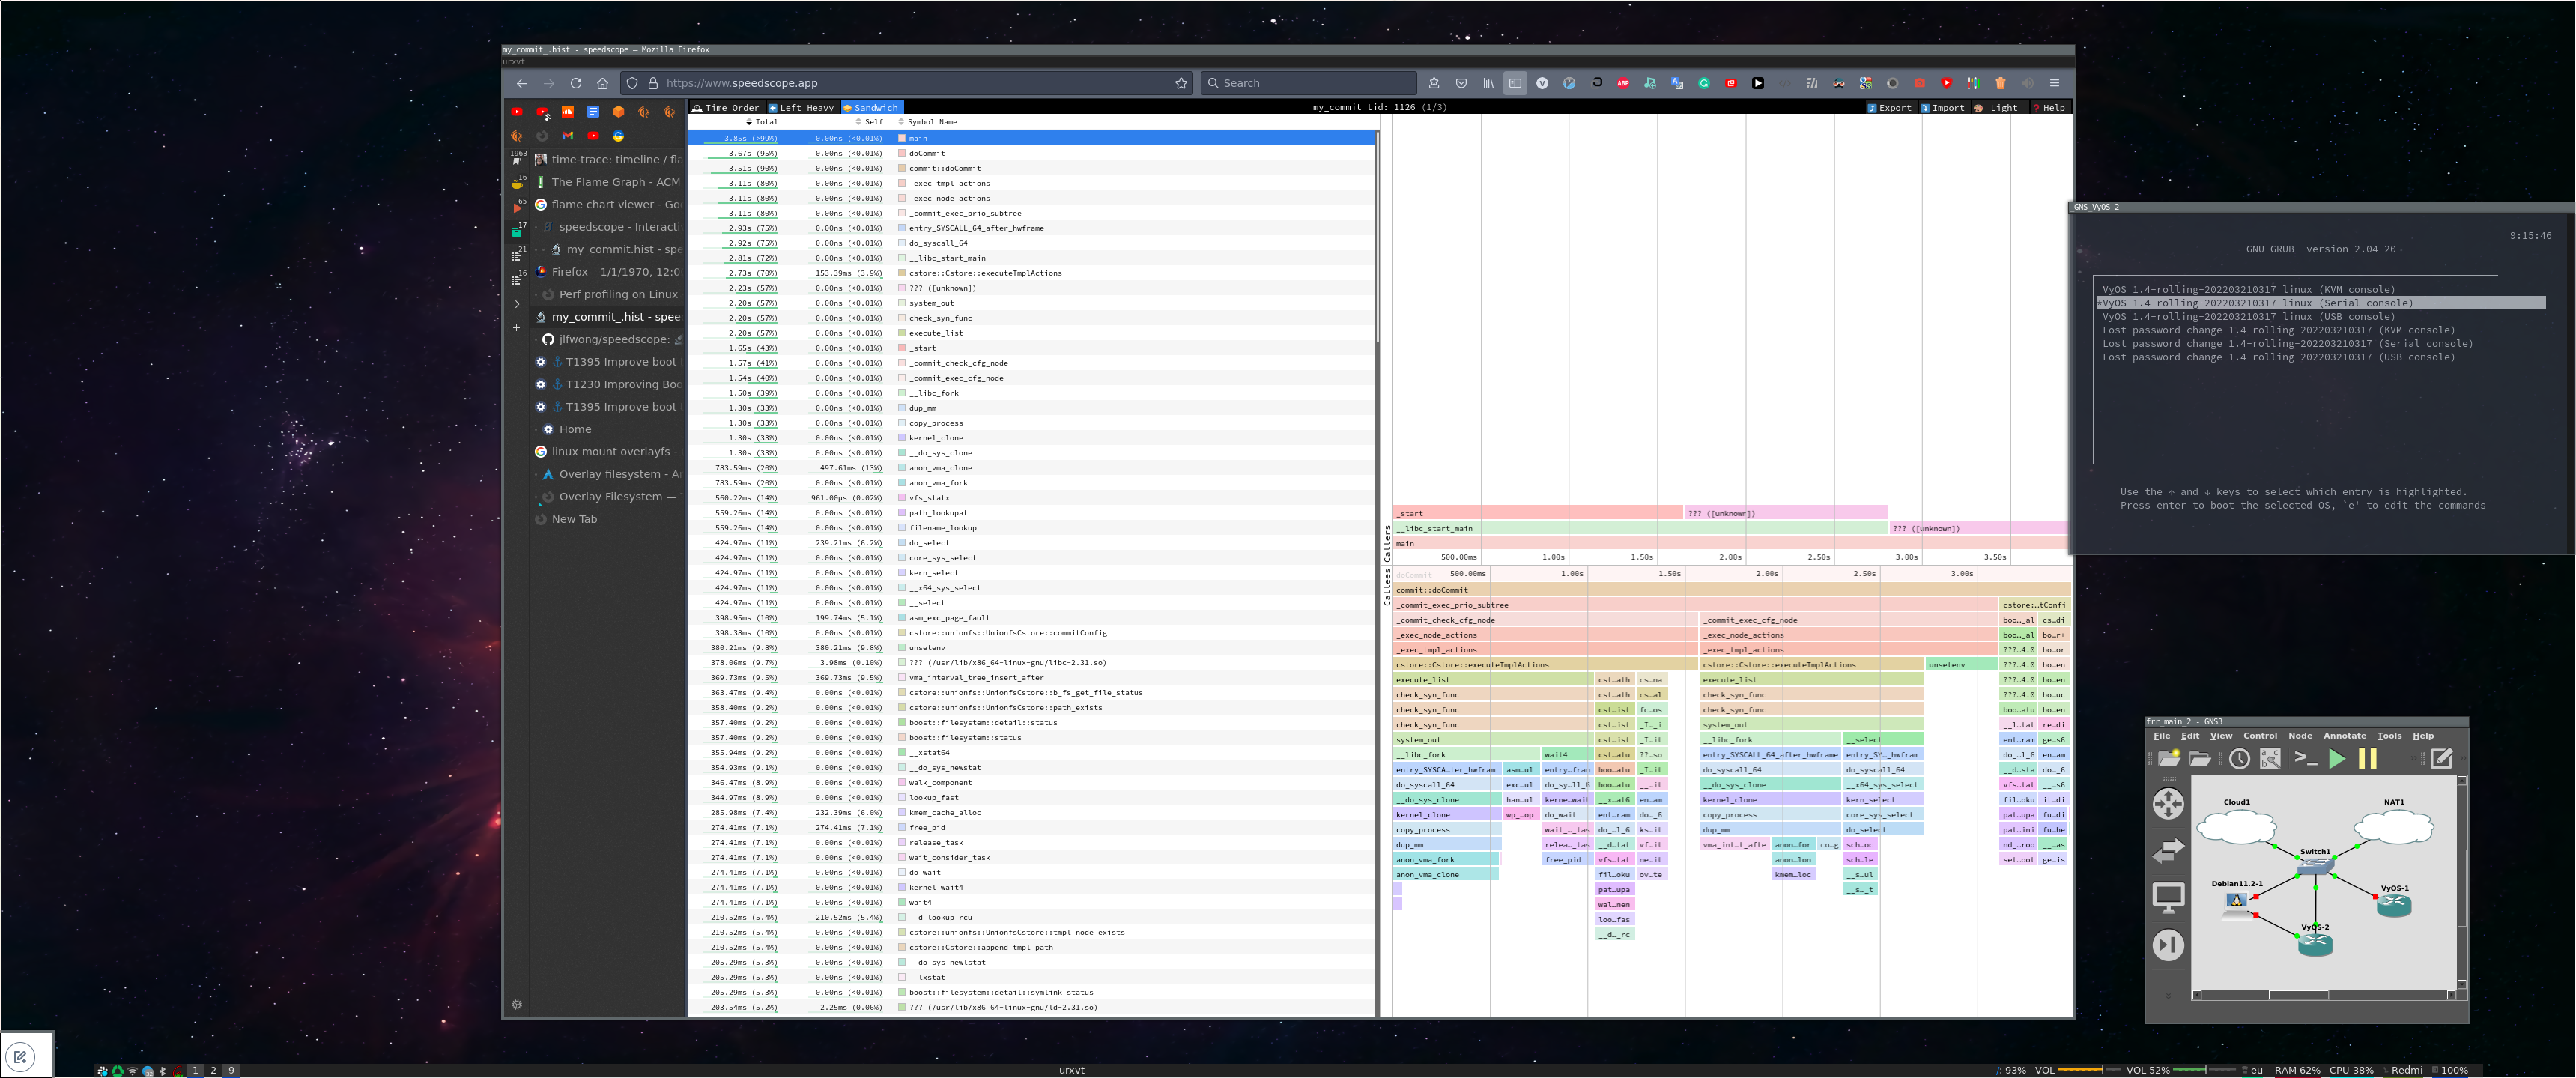
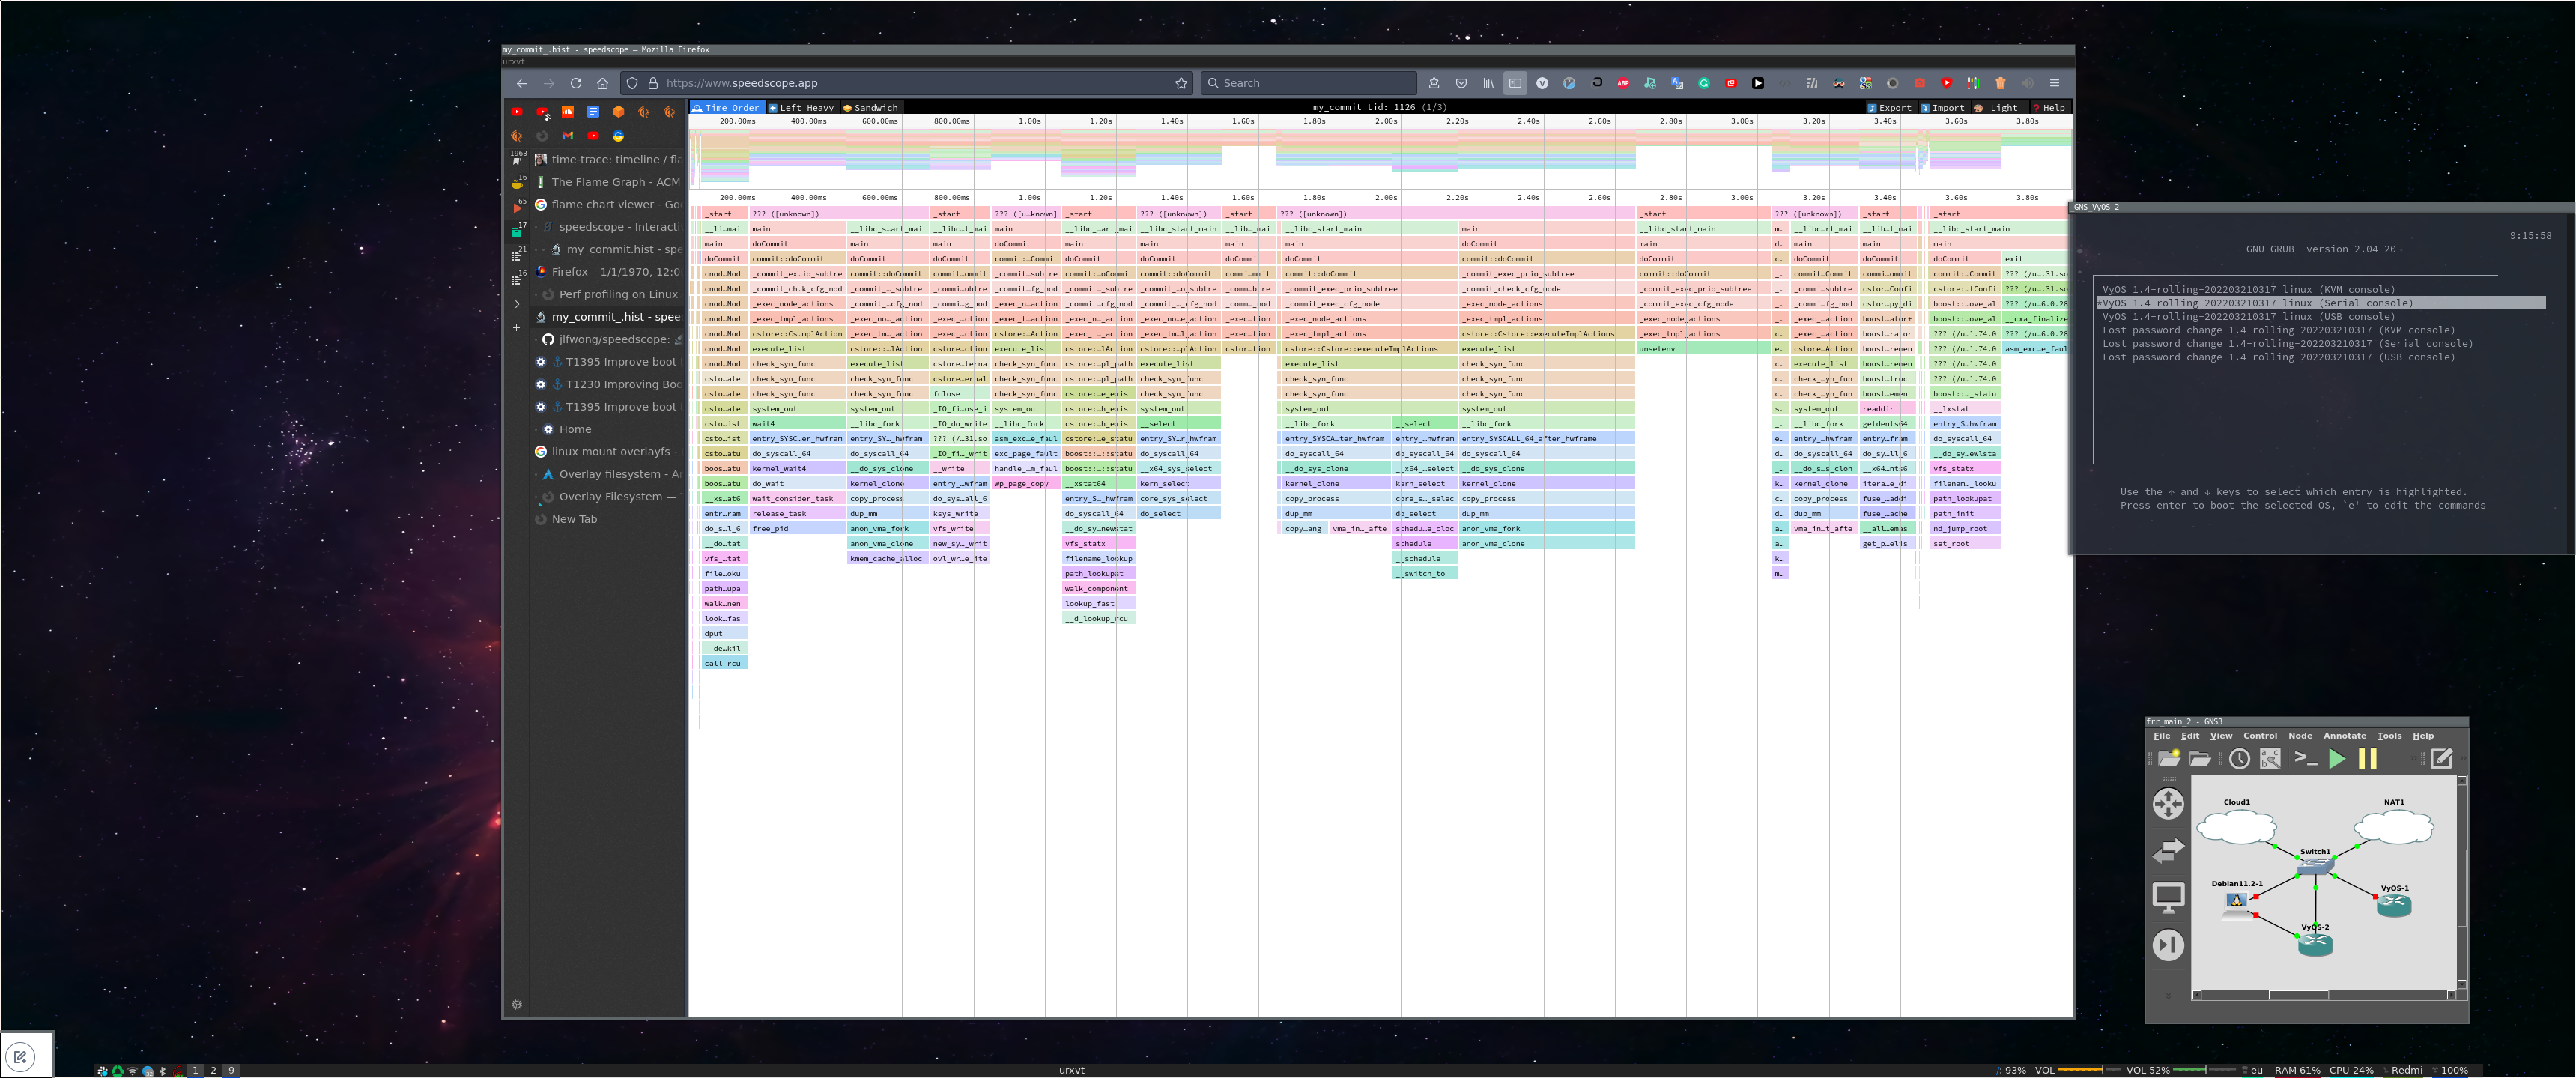
  2. Analyse using profiler.firefox.com / www.speedscope.app
http://jamie-wong.com/post/speedscope/
https://profiler.firefox.com/docs/#/

t1.png (1×3 px, 1 MB)

t2.png (1×3 px, 1 MB)

t3.png (1×3 px, 1 MB)

I`m going to try analyzing the performance issues for large configs like the following:

I have tried the 40k firewall-config, but my device ran out of the memory generating the perf.data

  • The question is, how do I manually mount the overlay fs from the grub
  • It would be great to find a minimal config where performance degradation is noticeable

Details

Difficulty level
Unknown (require assessment)
Version
all
Why the issue appeared?
Will be filled on close
Is it a breaking change?
Perfectly compatible
Issue type
Improvement (missing useful functionality)

Event Timeline

v.huti updated the task description. (Show Details)

There was some effort to introduce profiling into the system before, but nothing was developed.
The ticket was opened to verify that the timing values displayed in /var/log/vyatta are correct.
The vyos-debug flag enables tracing for actions described in the templates.
This will be a step-by-step walkthrough of the system profiling, as I have found this to have a bunch of non-obvious technical nuances that might get you stuck.

NOTE: by default, the perf binary is not installed on the ISO image.

The perf wrapper script is available, but no binary is present.
On a typical Linux machine, you need to install the linux-tools package for the binary.
@zdc have linked me to http://dev.packages.vyos.net/?dir=repositories/current/pool/main/l.
From my testing, the package from the link fails installation on some dependencies.
You can configure apt as a testing workaround to download the package from Debian servers.

## NOTE: the apt configuration was taken from the vyos/vyos-build:current docker -> /etc/apt/sources
sudo sh -c "echo '
# deb http://snapshot.debian.org/archive/debian/20220228T000000Z bullseye main
deb http://deb.debian.org/debian bullseye main
# deb http://snapshot.debian.org/archive/debian-security/20220228T000000Z bullseye-security main
deb http://security.debian.org/debian-security bullseye-security main
# deb http://snapshot.debian.org/archive/debian/20220228T000000Z bullseye-updates main
deb http://deb.debian.org/debian bullseye-updates main
' > /etc/apt/sources.list"

sudo apt update
sudo apt install linux-tools
# sudo ln -sf /usr/lib/linux.*tools.*/perf /usr/bin/perf

In the testing, it was noticed that accumulated time values in the log are much lower when compared with
the total time required to load the boot configuration.
Therefore, I'm modifying the config loading service to record the performance data.

/usr/libexec/vyos/init/vyos-router:
--------------------------------------------------
# load the initial config
load_bootfile ()
{
    log_progress_msg configure
    (   
        if [ -f /etc/default/vyatta-load-boot ]; then
            # build-specific environment for boot-time config loading
            source /etc/default/vyatta-load-boot
        fi

        if grep -q vyos-debug /proc/cmdline; then
            sudo sysctl -w kernel.perf_event_paranoid=-1
            sudo sysctl -w kernel.kptr_restrict=0 
            echo 0 > /tmp/vyos-config-status

            sg ${GROUP} -c "time $vyos_libexec_dir/vyos-boot-config-loader.py $BOOTFILE" &
            ps aux | grep vyos-boot-config-loader

            _pid=$(pgrep -f "python3.*vyos-boot-config-loader.py")
            perf record --max-size 500M -p $_pid  \
                         -g --call-graph dwarf   \
                         -o /home/vyos/perf.data \
                         -- sleep 60 &
        else
            sg ${GROUP} -c "$vyos_libexec_dir/vyos-boot-config-loader.py $BOOTFILE"
        fi
    )
}
------------------------------------------------
Technical nuances:
1. It can be assumed that the profiler will generate ~10MB/sec of samples for the config loader,
        meaning -> 2 min config load ~ 1.5G samples
   You should remember the amount of system available memory to avoid unpleasant situations.
   Processing 2G of samples takes > 0.5G RAM. Otherwise, perf gets OOM killed when performing
        `perf script --header > perf.hist`

2. Perf can analyze the subprocess or attach to one already active.
   Instead of running in the foreground, we send the loader process to the background.
   Using the '--max-size' flag becomes problematic if you run a command as a subprocess.
   Perf will kill the loader once the size limit is reached. However, we only want to collect the samples.

   Therefore, we attach it to the loader already running in the background.
   In addition, I'm providing the `sleep`  subprocess to limit sampling in time.
   I have also seen a strange bug when directly attaching perf would fail to terminate correctly,
  s meaning that collected data is not usable.

3.       echo 0 > /tmp/vyos-config-status
   This is a trick around the systemd, so it considers the initialization successful and drops you
   to the bash prompt.

4. Perf flags:
   If both --max-size and `sleep ..` is provided, the process is terminated on the first one to become true.
   You can avoid profiling the program initialization by delaying the start with the `-D <ns>` flag.

5. I'm using `time` to get bash execution metrics; therefore, you will see multiple similar entries in
   the process table. To get the right one, include python in the grep.
        pgrep -f "python3.*vyos-boot-config-loader.py"

You can find a simplified example for FRR here:
https://github.com/FRRouting/frr/wiki/Perf-Recording

Gotchas:

If you are running a small QEMU device and it has run out of the memory, the scenario is following:

- The boot process has failed, the prompt is stuck, bash is not initialized
- You reboot the device, it tries to read the config, fails once again as there is no free memory
- Config was not loaded, you cannot log in; it is a loop

To recover:

- Stop on grub, edit the menu entry, append `init=/bin/bash` to the `linux` field
- Boot into the root shell and remove the generated dumps or edit grub config to disable profiling
- Reboot into the regular system

Otherwise, you can extend the filesystem and try to boot once again.

sudo modprobe nbd max_part=10
sudo qemu-img resize VyOS-hda.qcow2 +5G
sudo qemu-nbd -c /dev/nbd0 VyOS-hda.qcow2
sudo gparted /dev/nbd0
# extend the used partition
# https://linuxconfig.org/how-to-resize-a-qcow2-disk-image-on-linux

Many processes executed during boot initialization generate the sampling noise.
The right way would be: to disable config loading at boot, login, manually load the config & collect the profiler data.
Looking at the /usr/libexec/vyos/init/vyos-router, you can find patterns like:

disabled configure || load_bootfile
log_end_msg $?

This looks like what I have described - it should be possible to disable the automatic loading by appending the no-vyos-configure argument to the grub entry.
I tried this during testing, but it didn`t work. If you don`t load the config, your user configuration is not applied, and you cannot log in.
Therefore, the only practical way is attaching to the already running loader process.


When testing different debug levels, I have noticed a couple of possible problems:

1. Your `perf script --header` may return a bunch of errors like
    `DWARF data block is larger than specified  (number) < (number)`
    It likely means you have messed up something in debug flags, like `-ggdb3` instead of `-ggdb`
    Just git clean + rebuild the packages before testing.
    TODO: test dwarf specific flags
2. If the package got stripped during compilation, the perf would track only the kernel stack.

Analysis:

I have collected the profiling data for the following configurations:

  1. Default config: profiler
  2. DHCP config: profiler, phabricator
  3. Big firewall smoke test. This one has issues with perf ;(

To convert the binary .data file into the .hist graph, issue sudo perf script --header.
You can parse the generated txt file to keep only interesting processes: sed -n /my_commit/,/^$/p perf.hist > commit.hist
The generated history file is piped to visualization tools so you can look at the callgraph, i.e.:

1. You can generate a standart flamegraph 
    $ git clone https://github.com/brendangregg/FlameGraph
    $ cd FlameGraph
    $ ./stackcollapse-perf.pl --all < perf.hist  > out.folded
    $ ./flamegraph.pl --hash  --bgcolor=green --count=pages < out.folded > out.svg
   You will likely want to open this file in browser so the interactive features are working
       i.e., zoom-in/out on stack frame, interactive search, highlight ...
   However, it is pretty basic and not as functional as alternatives.
2. `profiler.firefox.com` is the most convenient/comprehensive profiler I have found.
    Features that I have found useful:
    - Call Tree / Flame Graph / Stack Chart
    - Local data hosting. Analyzed profiles can be easily shared between developers/users.
      The project user can try to analyze the collected samples locally and share them in 1 click if developer support is needed.
      I.e., the default config-sample: https://share.firefox.dev/3LDZ1B6
    - Interactive stack visualization widget with call stack preview on mouse hover
      Click on the function, and it will be highlighted on the widget
    - Accumulation of trace time for the stack frame
    - Focus on the function filter. Displays only samples with chosen function.
      It makes it easy to see the used time on the widget + you can hover on the inactive process area
      to see what was happening outside of the main processing logic.
    - Interactive search filter synced with stack preview widget
    - Convenient keyboard controls
3.  `www.speedscope.app`. Features close to the previous, time-ordered call stack instead of the widget


Here are some of the metrics that I`m considering for this analysis:
1. The `time` summary, can be found at `artifacts.tar.gz -> /*/vyatta/cfg-stdout.log`
2. Difference against the cumulative time logged in `vyatta/cfg-stdout.log`
3. Time spent on debug print itself + timer manipulations
   output_internal             | debug print
   high_resolution_clock::now  | timer
4. Main processing points
   commit::doCommit            | main processing function
   _commit_exec_prio_subtree   | tree processing
                               | vyatta-cfg/src/commit/commit-algorithm.cpp:662
   \ _commit_check_cfg_node    | vyatta-cfg/src/commit/commit-algorithm.cpp:673
   \ _commit_exec_cfg_node     | vyatta-cfg/src/commit/commit-algorithm.cpp:674
      \ _exec_node_actions     | vyatta-cfg/src/commit/commit-algorithm.cpp:295
         \ _executeTmplActions | template execution
                               | vyatta-cfg/src/cstore/cstore.cpp:2035
           \_system_out        | method that evaluates code from node.def files, i.e.
                               |   run, syntax:expression:, commit:expression: 
5. Anything outside the `commit::doCommit`
NOTE: Tests were performed on the debug build of vyatta-cfg, commit 39d901c16aba8e159d8e250914e744fa74edacd3, with my patch applied.

Default config

Visualization (GIF):

perf.gif (21 MB)

  • doCommit
    doCommit.png (1×2 px, 609 KB)
  • prio_subtree
    prio_subtree.png (1×2 px, 565 KB)
  • check_cfg_node
    check_cfg_node.png (1×2 px, 520 KB)
  • commit_cfg_node
    exec_cfg_node.png (1×2 px, 580 KB)
  • exec_cfg_node
    exec_cfg_node_.png (1×2 px, 459 KB)
  • executeTmplActions
    executeTmplActions.png (1×2 px, 529 KB)
  • sytem_out
    system_out.png (1×2 px, 557 KB)
  • output_internal
    vy_output_internal.png (1×2 px, 517 KB)
  1. Compiling timing metrics
Accumulated time for template processing: 4.532s
NOTE:  4.5sec is `real-time`, meaning it includes `user + sys + sleep`

Process time
    May 01 21:20:01 vyos vyos-router[1315]: real        0m6.176s
    May 01 21:20:01 vyos vyos-router[1315]: user        0m1.630s
    May 01 21:20:01 vyos vyos-router[1315]: sys        0m1.250s

 Time spent for debugging purposes (focust on function)
                       ::now < 100ms
    ::output_internal = 1s

Looking at these metrics, we can assume that config tree initialization is a relatively short process compared to template execution.
It took us 4.5s for templates and the rest 1.7 for initialization and the following fs sync.
  1. Processing points
    commit::doCommit 
    Traced running time : 4.7sec
    In Kernel space     : 64% ~ 3sec
    In User space       : 36% ~ 1.7sec
    |\
    | \ _commit_exec_prio_subtree
    |   Traced running time : 4.6sec
    |   In Kernel space     : 60%
    |   In User space       : 40%
    |
    |\
    | \ _commit_check_cfg_node
    |   Traced running time : 2.6sec
    |   In Kernel space     : 65%
    |   In User space       : 35%
    |   \
    |   \ _exec_node_actions
    |     Traced running time : 2.6sec
    |     In Kernel space     : 65%
    |     In User space       : 35%
    |
    |\
    | \ _commit_exec_cfg_node
        Traced running time : 1.9sec
        In Kernel space     : 60%
        In User space       : 30%
        \
        \ _exec_node_actions
          Traced running time : 1.85sec
          In Kernel space     : 57%
          In User space       : 43%

--------------------------------------------------------------------------
    _exec_node_actions
    Traced running time : 4.5sec
    In Kernel space     : 63%
    In User space       : 37%
    |
    |\
    | \ _executeTmplActions
    |   Traced running time : 4sec
    |   In Kernel space     : 67%
    |   In User space       : 33%
    |   \
    |   \ execute_list                   <=== function traced by VYOS_DEBUG
    |     Traced running time : 2.5sec
    |     In Kernel space     : 84%      <====== main processing
    |     In User space       : 16%
    |
    |\
    | \ cstore::Cstore::output_internal  <====== function printing to the file
    |   Traced running time : 1sec
    |   In Kernel space     : 50%
    |   In User space       : 50%
    |
    |\            
       \ std::tr1::shared_ptr::~shared_ptr
          It takes 450ms to deallocate tmp (?) `Cpath` objects used in the function

5. Anything outside the `commit::doCommit.`
   Before the method - two milliseconds to initialize the config tree objects
   Before the finish - 0.5s system call `clone,` likely the fs update after loading

DHCP config

I have tried analyzing the attached config. According to the comment

In Attachment vyos configuration with 298 Vlans and 298 DHCP servers.

Every commit takes about 11 seconds.
A reboot takes about 12 minutes to load all vyos configurations.

I have applied configuration, saved the file, and executed a reboot to get the profiling samples.
The config took only 72 seconds in practice, which looks not right to me.
I assume that it would take less time than described in the comment.
It is pretty old, and performance has been improved since then, but not that much.
Going to sync with the ticket creator - @zdc


The big firewall - vyos-1x/smoketest/configs/firewall-big

So apparently, perf fails at such massive configurations, to sample it somehow (unless I`m doing it wrong :)
In testing, I can see no my_commit process mentioned in the generated perf.hist.
On the opposite, all child processes used for tree validation are sampled and noticed in history.

It is unclear why it works for the previous configs but fails here. The root cause ideas include:

  1. The call stack for this config is too deep; perf can't demangle it; therefore, no entry is generated(????)
  2. The first few minutes of config are doing +- the same operation; therefore, we don`t notice the main stack trace (it is possibly sleeping most of the time)
  3. This config does some magic under the hood (?????)
  4. idk ...

TODO: test with the extended DWARF stack

Anyway, we can look at the other collected metrics.

Accumulated time for template processing: 214.248s => 3m34s
Process time
real        7m12.155s
user        1m57.035s
sys        2m6.238s

We have spent  only half of the processing time for the template execution.
The question is what was happening the rest of 3m and if there this can be optimized.

Practically speaking, you would avoid collecting performance for a long-standing process since it takes too many resources + negatively affects the performance.
Anyway, you will not look through 10+ minutes of samples even if you have managed to collect them.
In the case of big configuration files, the advice is to split them into manageable independent pieces and try to profile them separately.


Memray:

In order to keep useful tracing/debugging tooling in a single place, the @jestabro has created the repo:

https://github.com/jestabro/profiling-tools

Since there is no vyatta package yet, you need to either compile it by hand or install it from the apt
as explained before. Some examples to play around with:

# NOTE: I had to downgrade this package to resolve the installation conflict
# sudo apt-get install python3-pkg-resources=45.2.0-1
  sudo apt-get install python3-pip
  sudo python3 -m pip install memray
  PATH+=":/home/vyos/.local/bin"

---------------------------------------------------
  python3 -m memray run --live /usr/libexec/vyos/tests/smoke/cli/test_protocols_bgp.py
  python3 -m memray run -o output.bin profiling-tools/memray/mandelbrot.py
  python3 -m memray flamegraph output.bin
  scp $vyos:memray-flamegraph-output.html .

Other development ideas:

I have not seen in practice a NOS with any decent profiler integration.
Having such a profiler should lower the entrance gate into the project for the less experienced engineers.
The engineer can see the call stack across the entire program execution. Such convenient access to the execution data simplifies the research effort.

So far, I have profiled only the config loader, although this should be useful in many other contexts:

- Tracing user process. The user needs to install the debug symbols, and he can conveniently collect `perf.data` for the following analysis, i.e
    $ monitor trace "$pid" 10sec "$out_file"
          .... performance profile was collected to $out_file
- An CLI top-level operation modifier
  This can be usefull to profile other CLI commands that might take extra time like:
         load / add / delete / generate ...
     configure: commit, load, merge, save, show ...
    $ trace "$cmd ..."
          ..... performance profile collected to "$cmd".data
    # trace load $cfg_file
    # trace commit
    # trace save
         ....

Python/Perl methods demangling (name decoding)
The issue - `perf` dropped the Python support a couple of years ago.
When collecting the performance profile, you cannot see the frame names for python processes.
Instead, it will display some generic python runtime method.
It should not be hard to integrate some open-source python profiler if there is interest.
  https://github.com/benfred/py-spy
  https://github.com/P403n1x87/austin#examples=
Any interest in the memory profilers?
  https://github.com/bloomberg/memray
dmbaturin added a project: VyOS 1.4 Sagitta.