Hi,
Thank for the telegraf plugin.
It will be usefull that we can use outputs.prometheus_client directive in vyos-telegraf.conf file
https://github.com/influxdata/telegraf/blob/master/plugins/outputs/prometheus_client/README.md
Regards,
Pierre
| NceAirport | |
| Mar 24 2022, 9:15 AM |
| F2665588: prometheus.png | |
| May 3 2022, 9:58 AM |
Hi,
Thank for the telegraf plugin.
It will be usefull that we can use outputs.prometheus_client directive in vyos-telegraf.conf file
https://github.com/influxdata/telegraf/blob/master/plugins/outputs/prometheus_client/README.md
Regards,
Pierre
@NceAirport do you have a minimum required configuration?
As I see it should be something like:
set service monitoring xxx prometheus authentication login xxx
set service monitoring xxx prometheus authentication password xxx
set service monitoring xxx prometheus port 9273
set service monitoring xxx prometheus network 192.0.2.0/24
and conf:
[[outputs.prometheus_client]]
  listen = ":9273"
  basic_username = "xxx"
  basic_password = "xxx"
  ip_range = ["192.0.2.0/24"]
PR
https://github.com/vyos/vyos-1x/pull/1310
minimal configuration:
set service monitoring telegraf prometheus-client
Possible options:
set service monitoring telegraf prometheus-client allow-from '192.0.2.0/24'
set service monitoring telegraf prometheus-client authentication username 'vyos'
set service monitoring telegraf prometheus-client authentication password 'vyospass'
set service monitoring telegraf prometheus-client listen-address '192.0.2.1'
set service monitoring telegraf prometheus-client metric-version '2'
Check:
vyos@tstrtr2:~$ curl http://10.x.x.23:9273/metrics | egrep -v "#" | head -n 15
% Total % Received % Xferd Average Speed Time Time Time Current
Dload Upload Total Spent Left Speed
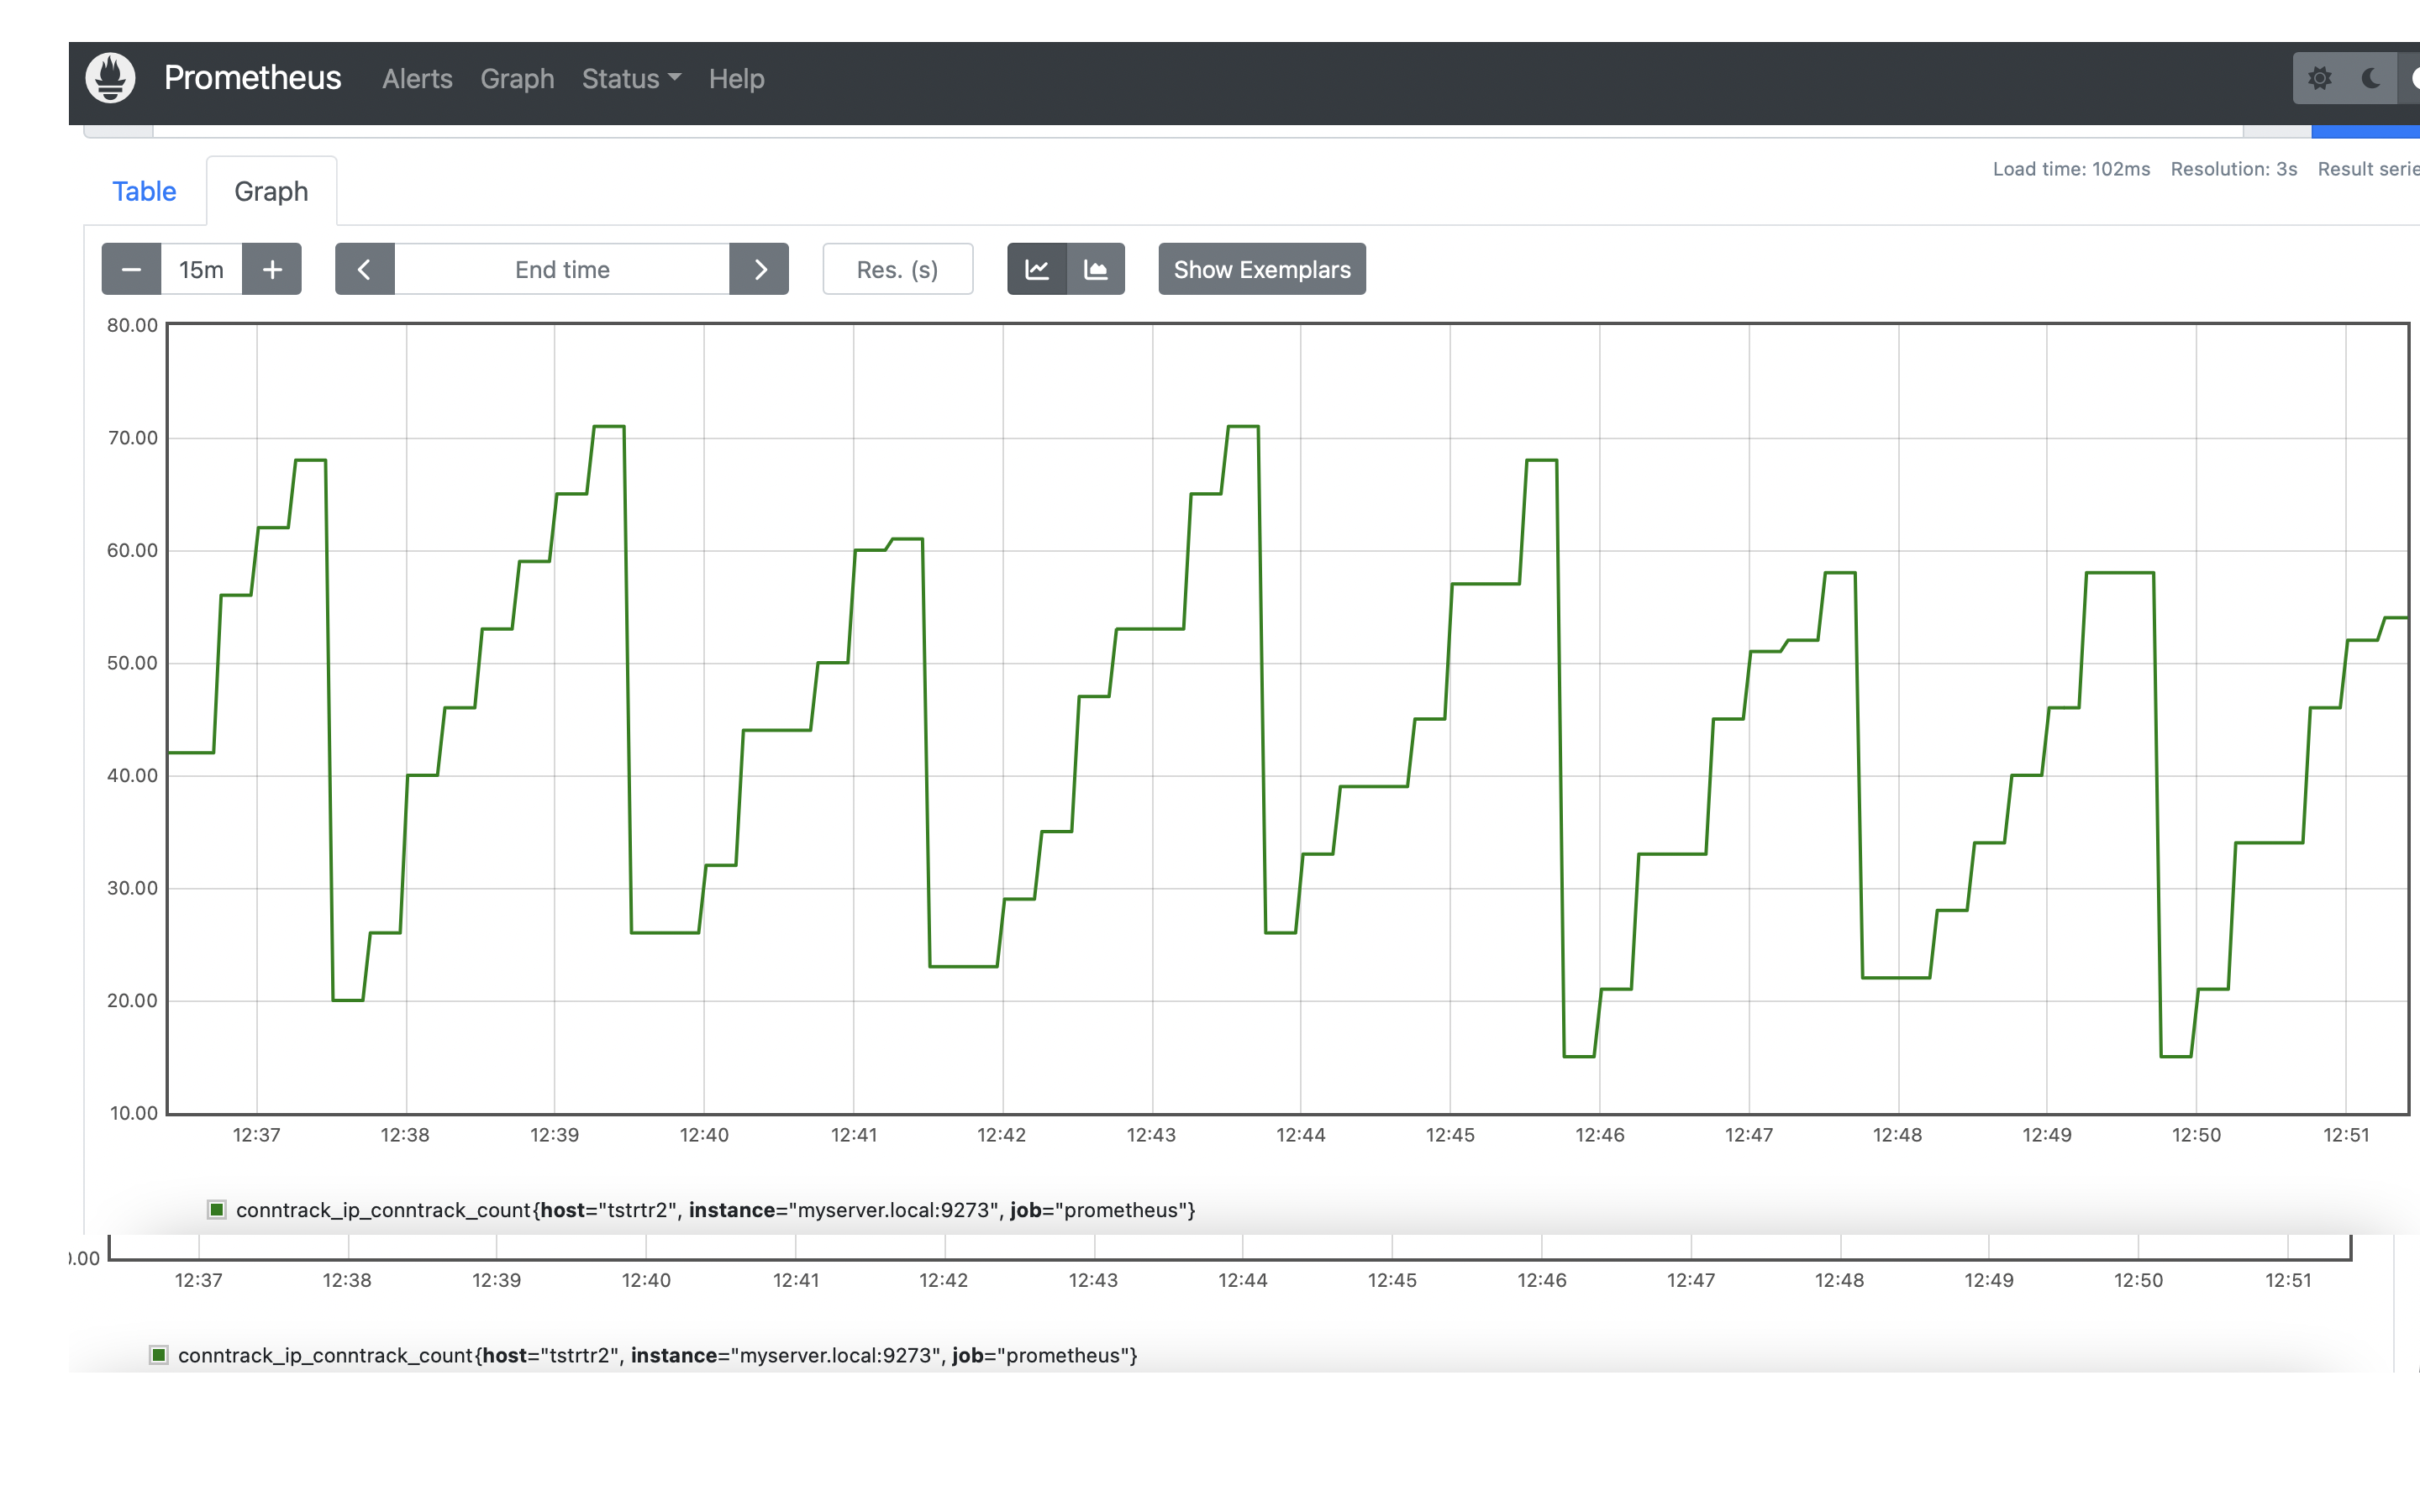
0 0 0 0 0 0 0 0 --:--:-- --:--:-- --:--:-- 0conntrack_ip_conntrack_count{host="tstrtr2"} 16
conntrack_ip_conntrack_max{host="tstrtr2"} 262144
cpu_usage_guest{cpu="cpu-total",host="tstrtr2"} 0
cpu_usage_guest{cpu="cpu0",host="tstrtr2"} 0
cpu_usage_guest_nice{cpu="cpu-total",host="tstrtr2"} 0
cpu_usage_guest_nice{cpu="cpu0",host="tstrtr2"} 0
cpu_usage_idle{cpu="cpu-total",host="tstrtr2"} 99.40253920837839
cpu_usage_idle{cpu="cpu0",host="tstrtr2"} 99.40253920837839
cpu_usage_iowait{cpu="cpu-total",host="tstrtr2"} 0
cpu_usage_iowait{cpu="cpu0",host="tstrtr2"} 0
cpu_usage_irq{cpu="cpu-total",host="tstrtr2"} 0
cpu_usage_irq{cpu="cpu0",host="tstrtr2"} 0
cpu_usage_nice{cpu="cpu-total",host="tstrtr2"} 0
cpu_usage_nice{cpu="cpu0",host="tstrtr2"} 0
cpu_usage_softirq{cpu="cpu-total",host="tstrtr2"} 0