Page MenuHomeVyOS Platform

FRR operational-data pagination
Open, HighPublicFEATURE REQUEST

Assigned To
Authored By
v.huti
Jun 9 2022, 2:00 PM
Referenced Files
F2786392: Peek 2022-06-21 16-58.gif
Jun 21 2022, 2:38 PM
F2786390: example_frr_conf.tar.gz
Jun 21 2022, 2:38 PM
F2786391: .gdbinit
Jun 21 2022, 2:38 PM
F2757120: FRR_Centralised_Managment_Daemon_proposal.pdf
Jun 16 2022, 1:29 PM
F2757012: frr_demo.gif
Jun 16 2022, 12:39 PM
F2757022: out.txt
Jun 16 2022, 12:39 PM
F2757023: in.txt
Jun 16 2022, 12:39 PM

Description

The problem:

The current FRR implementation lets you fetch particular config objects in one iteration.
This becomes problematic when querying a bulk state data (e.g. millions of routes) as it holds the CLI/Object
until it is fully displayed. There is no way to limit requests to "n" first objects, etc...
In such a case, you are reading the entire object and skipping the uninteresting data, which is very inefficient.

There should be an easy-to-use and robust mechanism to split (paginate) the data into manageable pieces.

Solution:

This problem has already received some attention from the frr community, but the proper solution was not
developed/finished yet.

1. Previously, the northbound architect created a pull with the solution, but after multiply rounds of
   review, he stopped active contributions to the project. So that PR was not merged in the end.
         https://github.com/FRRouting/frr/pull/6371
2. Currently, the community with engineers from the `VMware` team is working on the new
          `Centralised Management Daemon (MGMTD)`
   One of the development goals is -
     '13. Support for batching and pagination for display of large sets of operation data.`
     https://github.com/FRRouting/frr/wiki/FRR-Centralized-Management-Requirements
   The pull request tracking the development: https://github.com/FRRouting/frr/pull/10000
   Is in development for about 2 years, ~20k lines of code, doesn't look like it will be merged soon

The [2] is being actively developed, but a lot of work must be done before it can be used in practice.
It is good enough for some basic tests, but the DB connection is available only for staticd and part of zebra.
More details will be described in the follow-up comments.

Regarding the [1]:
After trying to develop some hacky solutions, I realized that most of my ideas are already implemented in the dropped PR.
Since there have not been many changes to the northbound architecture, it is possible to merge it back by hand and customize it for our needs.
The basic demo can be found at:

https://github.com/volodymyrhuti/frr/tree/oper_data_pagination_dev

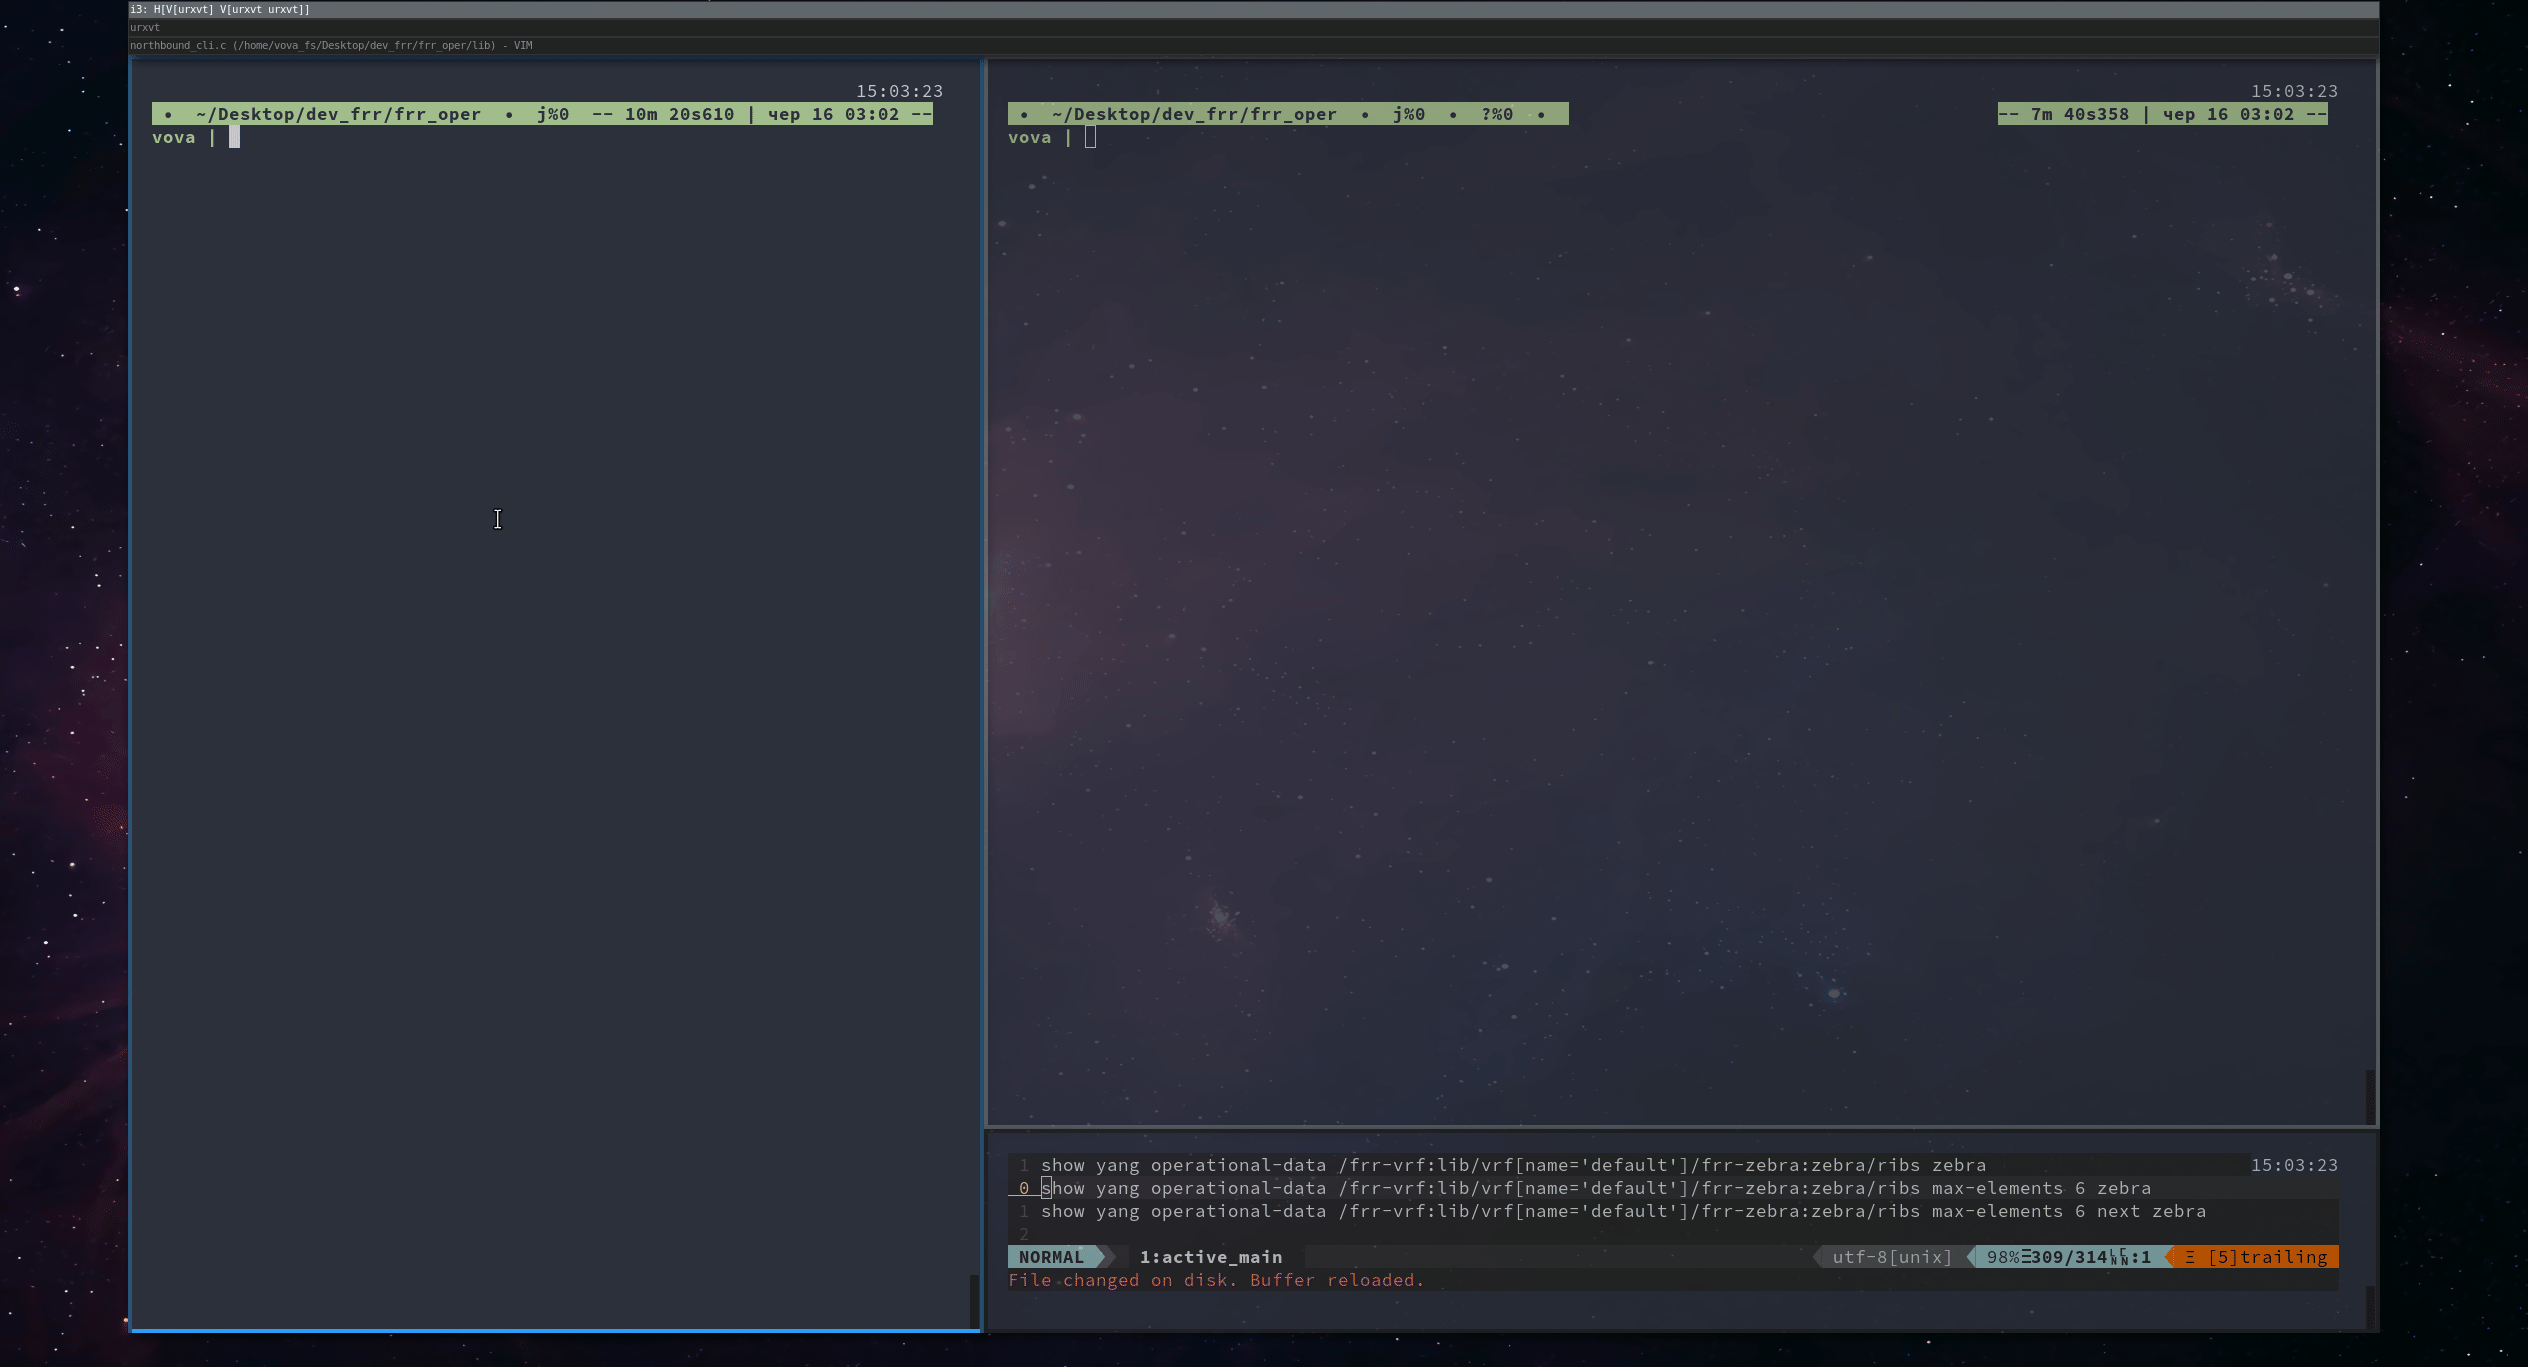
The PR introduces a new cli flags to perform data fetching with pagination

Fetching #n first elements
show yang operational-data <xpath> max-elements <n> <demon>
Fetching all elements by #n elements per iteration
show yang operational-data /frr-interface:lib max-elements 3 repeat zebra

To demonstrate how it can be extended, I have introduced a new flag next that does an iteration
starting from the previous one.

Demo example :


Demo visualization (GIF):
frr_demo.gif (11 MB)


Details on the development and the timeline will be in the following comments.

Details

Difficulty level
Unknown (require assessment)
Version
-
Why the issue appeared?
Will be filled on close
Is it a breaking change?
Unspecified (possibly destroys the router)
Issue type
Feature (new functionality)

Event Timeline

v.huti created this object in space S1 VyOS Public.

Recently, I had a conversation with the VMware team lead - Pushpasis Sarkar.
He has described the ongoing development and explained the use case they are interested in.
From the conversation:

1. The latest proposal draft: 
   Page 72-73 `Retrieve Operational Data - Retrieving Containers and Leaf members`
   Page 84-85 `Retrieve Operational Data - Retrieving Large List elements` + comments
   Page 86 `Retrieve Operational Data - Retrieving Containers and Leaf members` + comments.

2. Scaling issues and risk of segfaults
   The current configuration interface does not scale well.
   Once operating with massive objects (100k+ routes at a time, etc..), frr runs a high risk to segfault.
   Because of this issue, they are not displaying the routing table on UI after a certain threshold.
-  Current target is to be able to query 1 million BGP routes without segfaults
-  The next step: each route should have 4/8/16 next-hops, meaning UI will receive 4/8/16 * 1mill objects

3. Chunk size.
-  My implementation introduces the `max-elements` option that limits the number of requested data.
   It may be updated on the following requests with `next` option, i.e.:
        show yang operational-data <path> max-elements 10 zebra
        show yang operational-data <path> max-elements 100 next zebra

-  In current MGMTD implementation, the batch has a fixed size.
   mgmt_defines.h:
       #define MGMTD_MAX_NUM_XPATH_REG 128
       #define MGMTD_MAX_NUM_DATA_REQ_IN_BATCH 32
       #define MGMTD_MAX_NUM_DATA_REPLY_IN_BATCH 8

   According to `Pushpasis,` the aim is for the backend daemon to decide how much data it can send at the moment.
   It is possible to introduce fixed-size requests into MGMTD, but that will need the community consensus.
   For more details, check the doc pages described in [1]

4. GUI connection to the FRR.
-  My expectation was that client would send the request whenever it want the additional data.
-  In the MGMTD, the daemon triggers the fronted client callback until the entire object is returned
   For more details, check the doc pages described in [1]

5. Timeline. The feature has been in development for two years, and it will take a lot of time to finish.
   He had mentioned a case when they came to an agreement with the community on some design choices but
   it was dropped later in the discussion, therefore considerably reverting the progress.

   Once the MGMTD core is finished, all of the demons should be moved to Northbound data models
   and architecture. Unfortunately, many demons don`t have a data model designed/developed, i.e. `bgp`.

6. Testing
    Currently, they are testing the MGMTD by feeding a configuration file to vtysh with 10k of static routes.
    Actually, the frr has a separate demon for scale testing called `sharpd`, but it is not connected to the infrastructure

Ongoing activity:

1. Stabilization
-  I have seen a corner case that would crash inside the northbound callbacks.
-  I can see some validation failure logs, although the resulting output seems good for me.
-  Daniil was concerned about memory leaks associated with iteration state.
   After additional research - this is not a problem, but I can imagine cases where we would
   fail to handle a malformed XPath and leak resources on the stuck unwinding
   I need to do some testing with Valgrind.
2. Scale testing
3. Async support for multiple vtysh clients. The current demo assumes that there is only one client.
   I want to map the iteration state to the vtysh client/socket so multiple requests may be executed in parallel
4. A debugging instruction
   I have used some complicated debugging flow when merging the feature.
   This should be useful for other (non-C) devs.
5. Finishing the documentation
6. advanced XPath filtering support?

Since the last update, I have simplified the CLI interface:

1. I have removed the global iterator and incapsulated the iteration state into the vty structure.
   This way, each vtysh client has its private iteration state for the following requests.
   It should be possible to query multiple data nodes simultaneously and asynchronously.

   The overhead is two buffers of 1024 bytes to keep track of the requested XPath and offset.

2. Since vty keeps track of the previously requested arguments, there is no need to explicitly specify
   them on the `next` requests. So that usage pattern becomes:
     $ show yang operational-data <xpath> max-elements <n1> <daemon>
     $ show yang operational-data next <daemon>

   As well, it is possible to modify the query size for each request individually
      $ show yang operational-data next max-elements <n2> <daemon>

3. The current implementation is decent enough for the testing/prototyping, although it requires
   additional testing before it can be used in production.
   The changes to CLI argument order might have corner cases that I have missed.
   The same applies to the asynchronous handling that should be tested for scaling/etc...

   The test plan will be presented once the API is finalized.

FRR Debugging


Recently, I had to triage/debug a bunch of issues that involved running a legacy build of frr.
This involved:

  • Triaging issue down to the place when it was introduced. Otherwise, verifying that feature was never working at all.
  • Comparing the execution flow between legacy/master versions to identify the divergence
  • Building & running multiple (legacy/master) frr versions in parallel
  • Doing deep analysis within gdb

Tips/guidelines on the FRR debugging


  1. Debug Build

Typically, I`m building frr as follows.

# generate build config
$ debian/rules
$ make -j $(nproc --all)
$ sudo make install
$ service frr stop
$ service frr start

Under this flow, you want to modify the debian/rules to disable the optimizations and generate
the debug symbols. An example can be seen on my demo branch -

https://github.com/FRRouting/frr/commit/d8f4aad06b33bb23a98c2dd8d6b2c0ad30636b5d
  1. Check your the exported build flags dpkg-buildflags --export=sh
  2. Modify them to include -O0 -g3 -ggdb3 & export; this will generate the debug symbols
  3. Use the following FRR flags:
--enable-static-bin \
--enable-static \
--enable-shared \
--enable-dev-build \

Once the build is finished, you should be able to attach to the frr daemons with gdb and see the backtrace symbols and the source code lines.


  1. Basic Setup

To not mix your local network configuration with FRR ones, it is recommended to use the network spaces.
You can find the step-by-step guide at: https://dlqs.dev/frr-local-netns-setup.html

Start the first instance of FRR, however, your OS does it.
    On Archlinux, this is: sudo systemctl start frr
Setting up another netns and interface
    Create a network namespace (ns) named blue (or any other name): ip netns add blue
    Verify it: ip netns list
    Create two interfaces ip link add veth0 type veth peer name veth1
    Verify the two appear: ip link list
    Move veth1 from the global ns to the blue ns: ip link set veth1 netns blue
    Verify that veth1 is gone from the global ns: ip link list
    Verify that veth1 appears in the blue ns: ip netns exec blue ip link list
Create a copy of /etc/frr, move it to a new directory: /etc/frr/blue
In /etc/frr/blue/daemons, set the blue ns: #watchfrr_options="--netns=blue"
Start the second instance of FRR: /usr/lib/frr/frrinit.sh start blue
vtysh into them, and verify veth0 and veth1 appear in the first and second instance respectively
    First: sudo vtysh, then show interface veth0
    Second: sudo vtysh -N blue, then show interface veth1
To stop the second instance of FRR: /usr/lib/frr/frrinit.sh stop blue

Example configuration:


  1. Using legacy builds

To debug the issue that I have introduced during the merge, I had to run a legacy version and
follow the flow through the code until I could notice the divergence.

This means that I need to run two FRR versions simultaneously, which creates a range of problems.
The main is that the legacy version (v7.5) is based on libyang v1 =>
Meaning you either install the v1 to be able to compile/test the legacy version or the v2 to work with the master.
For the legacy version, I have made a docker container based on frr/docker/debian/Dockerfile that has v1 libyang and can build/run the project.
TODO: add the docker file

In practice, it looks like this:

1. The `master` version is built on the host device and runs within the `blue` network namespace
2. The `legacy` version is built within the docker.
   Since docker doesn`t support the `systemd`, the package is configured with `--enable-systemd=no`
   After installation, it can be triggered with `frr/tools/frrinit.sh stop/start`
   Since there is no `journald`, you want to redirect the log to the local file
------------------------------------------------------------------------------------------------------
        /etc/frr/frr.conf:  log file /home/vova/frr.log
        touch /home/vova/frr.log
        chmod 777 /home/vova/frr.log
------------------------------------------------------------------------------------------------------

3. Once finished, the docker will leak the process into the host process space, meaning you can attach
   to it using gdb from the host (there is no need for gdbserver + target remote).
   Although, be careful to not confuse the processes
------------------------------------------------------------------------------------------------------
    ps aux | grep /frr/
    # -N blue present, master frr
    root     ...  /usr/lib/frr/watchfrr -N blue -d -F traditional --netns=blue zebra staticd
    frr      ...  /usr/lib/frr/zebra -N blue -d -F traditional -A 127.0.0.1 -s 90000000
    frr      ...  /usr/lib/frr/staticd -N blue -d -F traditional -A 127.0.0.1

    # -N blue missing, docker frr
    root     ...  /usr/lib/frr/watchfrr -d -F traditional zebra staticd
    systemd+ ...  /usr/lib/frr/zebra -d -F traditional -A 127.0.0.1 -s 90000000
    systemd+ ...  /usr/lib/frr/staticd -d -F traditional -A 127.0.0.1


   # attaching to the master version in blue namespace
   sudo gdb -p $(pgrep  -f "zebra.*blue")

   # attaching to the legacy version in the docker
   sudo gdb -p $(pgrep  -f "/usr/lib/frr/zebra -d")
------------------------------------------------------------------------------------------------------

  1. Debugging Strategies + gdb dashboard

Depending on your issue type, you will use different gdb functions. Some examples used when merging the feature:

  1. Break on error notification callbacks / northbound CLI methods.
(gdb) b ly_log_cb
# NOTE: frr commands are generated with the _magic suffix
(gdb) b show_yang_operational_data_magic
(gdb) cont
        ....
  1. Use read/write breakpoint to monitor the variable modifications (i.e. a global error holder errno)
rwatch [-l|-location] expr [thread thread-id] [mask maskvalue]
Set a watchpoint for an expression. GDB will break when the expr is written into by the program and its value changes

awatch [-l|-location] expr [thread thread-id] [mask maskvalue]
Set a watchpoint that will break when expr is either read from or written into by the program.

    (gdb) watch errno
    (gdb) watch ly_errno
    (gdb) watch *0xdeadbeef
  1. You can trigger the debugger from code by introducing a stub function
 static void break_point(void) {};
 ....

 if (... NOT_OK ...)
     break_point();
 ....

As it can be seen, the function does nothing, but this will work as a hook if the program is connected
ot the gdb and the breakpoint was configured via `b break_point`
  1. It is possible to manually trigger the internal functions and see the results in the debugger.
   I.e., this is useful when you are trying to understand the result difference when executing the
        same API with different arguments
   Though, it is highly likely that you will crash the gdb instance with a bad function call.
--------------------------------------------------------------------------------------------------------------
   (gdb) b break_point
   (gdb) cont
        ....
   (gdb) p (struct lyd_node *)lyd_new_path2(NULL, ly_native_ctx, xpath, NULL, 0,
                           0, 0, &dbg_parent, &dnode);

   (gdb) p (struct lyd_node *)lyd_new_path2(dnode, ly_native_ctx, xpath, NULL, 0,
                           0, 0, &dbg_parent, NULL);

        ....


NOTE: you need to stop the gdb session before restarting the daemon otherwise it will crash and stop
      responding

The visualization (GIF):

Peek 2022-06-21 16-58.gif (40 MB)

By default, the gdb provides some basic TUI (Terminal UI) interface that is not user-friendly.
In order to improve the debugging experience, it is recommended to use the GDB Dashboard interface.
My config with improved defaults:

Resources:
https://github.com/cyrus-and/gdb-dashboard
https://sourceware.org/gdb/onlinedocs/gdb/Set-Breaks.html
https://sourceware.org/gdb/download/onlinedocs/gdb/Set-Watchpoints.html

TBD: GUI

VyOS users can configure the front-end interface, called vycontroll, to examine the configuration state.
A detailed description can be found at:
https://vycontrol.com/
https://github.com/vycontrol/vycontrol
https://docs.vyos.io/en/equuleus/configuration/service/https.html
https://brezular.com/2021/05/01/vycontrol-web-ui-for-vyos-firewall/

It uses the Django framework to display the statically rendered router state.
The issue with such an approach is that it will try to render bulk state data in a single iteration.
As a result, the user's web browser will receive a massive HTML that may reach gigabytes.
I have attempted to request like 100k+ routes, which resulted in ~300MB HTML rendered to the browser.
In my understanding, this model should be changed to something more dynamic. From my previous experience of
porting UIs between routers, it can be done with an easy-to-use pattern:

index.html
---------------------------------------------
<js>

    data = AJAX.request("xpath", "max_size")
    display(data)

    function dataUpdate(...) {
        html = jquery.find("xpath")
        data = AJAX.request("next")
        if (!data)
            return

        /* enque the data update */
        display_update(html, data)
        window.setTimeout(1000, dataUpdate)
    };

    window.setTimeout(1000, dataUpdate)

</js>

I wanted to present something like this during the demo, but my front-end skills were not enough to understand
how to modify the vycontrol code.

Considering that my current solution is temporary until the MGMTd is not finished, we should consider:

1. Strategy used to move between the solutions
2. Data output differences
   - my solution works with json/xml formats
   - the mgmtd work with a `yang tuple`
   [  "xpath1" : value1,
      "xpath2" : value2,
      ...
   ]
3. Differences between DBs (config:true vs config:false)
4. Evaluate the Datamodel coverage for the features of interest
5. Data control flow differences
6. Extended XPath filtering for complex data manipulations, i.e.
   https://pastebin.com/raw/GJG3QcAf
7. ??
Viacheslav changed the subtype of this task from "Task" to "Feature Request".

Because there is a long-running development for operation data retrieval, we can postpone this ticket until an effort is finished.
Then, I can open a feature request or visit the yang meeting and start a discussion about the data pagination functionality.
Currently, my idea is to simulate pagination at the fs level by having a split of requested JSON.
This solution involves:

  • Fetching an operation data from the demon
vtysh -c "show yang operational-data /frr-vrf:lib/vrf[name='default']/frr-zebra:zebra/ribs zebra" > big.json
  • Fetching flat data stream and formating it 1 item (prefix) per line with jq -c option
jq -c '."frr-vrf:lib" .vrf[0] ."frr-zebra:zebra" .ribs .rib[0] .route[]' big.json | split -l 100 -d
  • Splitting result by the number of lines (objects), saving into files on the filesystem

Now, UI can display 1 of the resulting files at a time. These files may be regenerated on page refresh.
Such a solution will utilize extra disk space, although it can be avoided by using pipes and other
streaming utilities like awk/sed

https://stackoverflow.com/questions/49808581/using-jq-how-can-i-split-a-very-large-json-file-into-multiple-files-each-a-spec
https://copyprogramming.com/howto/split-a-json-file-into-separate-files
https://github.com/jqlang/jq/wiki/FAQ#streaming-json-parser


  • Currently, I can see two efforts related to data pagination on the backend

https://github.com/FRRouting/frr/pull/14428
https://github.com/FRRouting/frr/pull/14492

The first one introduces interesting filtering options that can be used to limit the size of the requested
data set

This is a full fledge implementation for retrieving operational state/data from one (or more) backend
component (provided the component already supports providing operational state through northbound layer).
This was based on the architectural/design discussions on MGMTd we had way back in 2021.
This PR completes the work needed on the MGMTd daemon and the MGMT backend client library needed for
MGMTd to get operational data from or one or more backend clients corresponding to the single GET-DATA
request received on front-end interface.

The second introduces a yield mechanism to query data from the backend in chunks.
However, it is not a ready solution for us and will require developing a front-end to maintain the
iteration state and feed data to UI in sections. This PR invalidates the previously ported patches.


For now, I assume that my method is good enough unless proven wrong in testing by the UI team ;)
I need to look at the UI code and chat with the UI team to get their perspective.